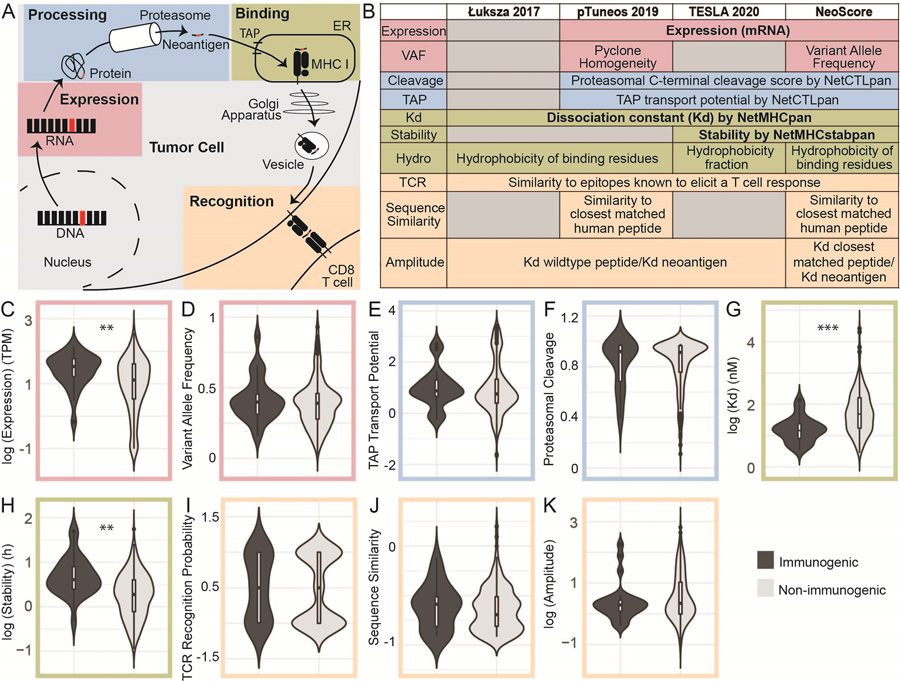
Figure 2. Expression, Dissociation Constant, and Stability are Significantly Different Between Immunogenic and Non-Immunogenic Neoantigens.
(A) Steps in the formation of an MHC class I-restricted immunogenic neoantigen. (B) Computationally predicted neoantigen characteristics included in development of the NeoScore model in comparison to three other models. Expression consists of the gene-level mRNA expression and clonality or variant allele frequency of the mutation. Processing consists of proteasomal cleavage and TAP transport potential. MHC class I binding is assessed through the MHC class I dissociation constant, binding stability, and hydrophobicity (Figure 3) of the neoantigen. The potential to stimulate a T cell response is assessed by the similarity to known T cell epitopes, the sequence similarity to normal human peptides, and the relative MHC class I dissociation constant compared to the dissociation constant of the closest matched normal peptide. All ten characteristics listed under the NeoScore model were considered for inclusion, and those in bold (expression, dissociation constant, and binding stability) were the characteristics selected for inclusion in the final model. (C-K) Comparison of the distribution of the characteristics for immunogenic and non-immunogenic neoantigens. (C) Log10-transformed distribution of mRNA expression. (D) Distribution of variant allele frequency (VAF) calculated by GATK Mutect2. (E-F) Distribution of proteasomal cleavage and TAP transport potential calculated by NetCTLpan. (G) Log10-transformed distribution of the MHC class I to neoantigen dissociation constant calculated by NetMHCpan. (H) Log10-transformed distribution of the MHC class I to neoantigen binding stability calculated by NetMHCstabpan. (I) T cell recognition (TCR) recognition probability calculated using the model from Łuksza et al. (J) Log10-transformed distribution of the BLOSUM62 sequence similarity between the closest matched human peptide and the neoantigen of interest, divided by the length of the neoantigen to normalize. (K) Log10-transformed distribution of the amplitude calculated as the ratio of the dissociation constant of the closest matched human peptide to MHC class I to the dissociation constant of the neoantigen to MHC class I. **:p<0.001, ***:p<10−5

