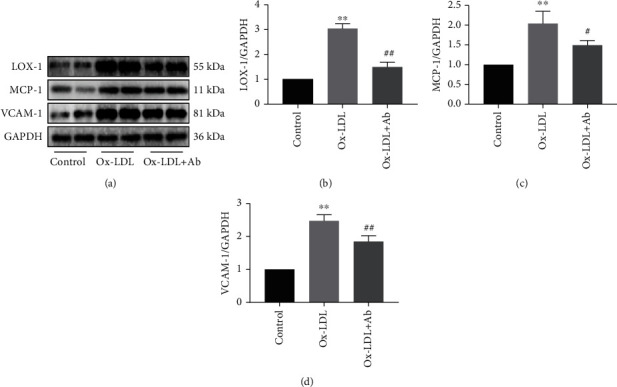
Figure 4.

Specific antibodies inhibited the inflammatory response of the endothelial cells and the expression of LOX-1. (a–d) The expression of LOX-1, MCP-1, and VCAM-1 in the three groups and the corresponding statistical graphs. Values are expressed as mean ± SD. ∗∗P < 0.01 vs. the control group. #P < 0.05 and ##P < 0.01 vs. the Ox-LDL group.
