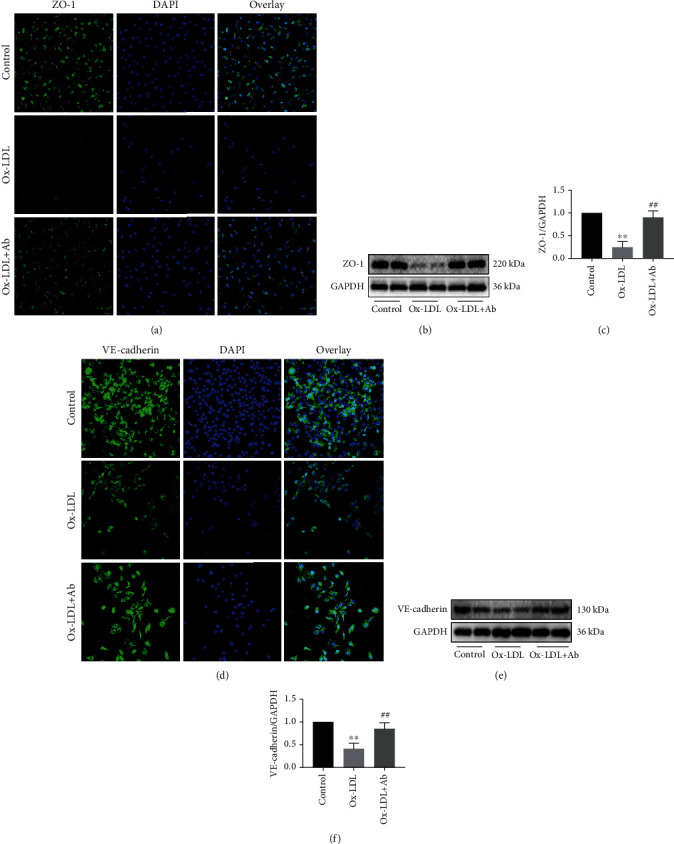
Figure 5.

Specific antibody intervention can significantly protect the expression of tight junction proteins in the vascular endothelial cells. (a) Confocal laser shows the different expression levels of ZO-1 (200x) in the three groups, where blue represents the nucleus and green represents the expression of ZO-1. (b) Western blot shows the expression level of ZO-1 in the three groups. (c) Quantitative analysis statistics of the expression levels of ZO-1 in the three groups. (d) Confocal laser shows the different expression levels of VE-cadherin (200x) in the three groups, where blue represents the nucleus and green represents the expression of VE-cadherin. (e) Western blot shows the expression level of VE-cadherin in the three groups. (f) Quantitative analysis statistics of the expression levels of VE-cadherin in the three groups. Values are expressed as mean ± SD. ∗∗P < 0.01 vs. the control group. ##P < 0.01 vs. the Ox-LDL group.
