
Figure 4.
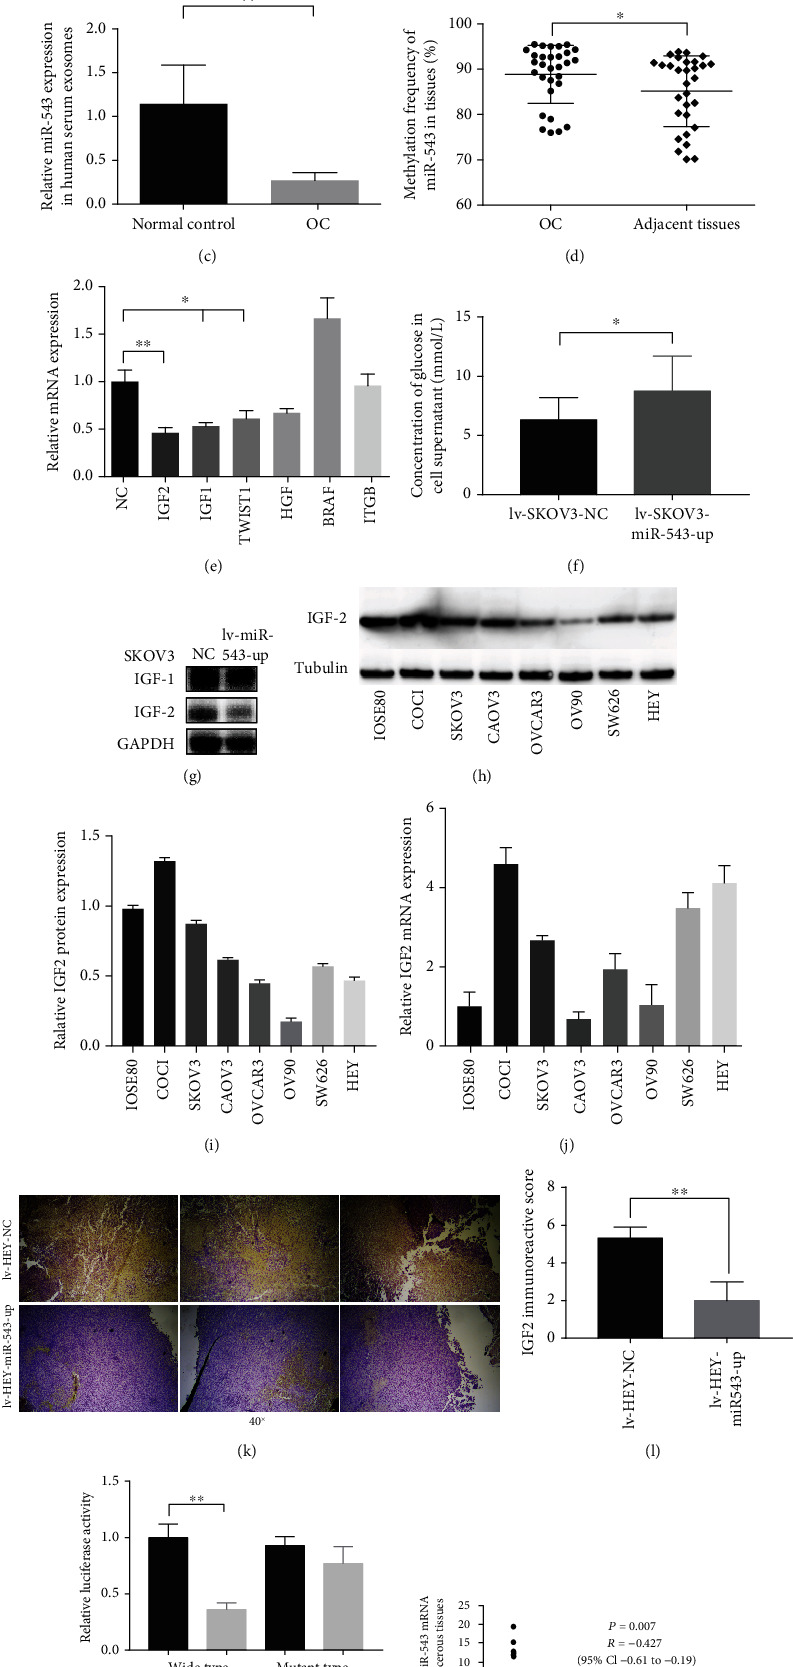
Regulatory network of miR-543 in inhibiting proliferation in EOC. (a) Similar to the bioinformatic analysis results, the expression of miR-543 was significantly lower in OvCa tissues than in normal ovarian tissues. (b) Exosomes derived from OvCa patient serum were verified by TEM and NTA. (c) The expression of miR-543 was also significantly lower in OvCa patient-derived exosomes than in normal control exosomes. (d) Compared to that in adjacent tissues, the methylation frequency of miR-543 in OvCa tissues was obviously higher. (e) The mRNA levels of predicted target genes of miR-543 that influenced survival were quantified by qRT-PCR in lv-SKOV-miR-543-up cells. (f) The glucose concentration in the cell supernatant was obviously increased in lv-SKOV-miR-543-up cells compared to control cells. (g) Although IGF1 and IGF2 are homologous proteins, WB assays showed that the protein level of IGF2 was significantly lower in lv-SKOV-miR-543-up cells than in control cells, while the IGF1 level remained the same between the two groups. (h–j) The protein and mRNA level of IGF2 in OvCa cell lines. (k, l) IGF2 was significantly decreased in upregulating miR-543 in the subcutaneous xenograft models than in controls. (m) The putative binding sites of miR-543 and IGF2 were predicted by using StarBase version 2.0 and verified by dual-luciferase reporter assays. (n) The mRNA levels of miR-543 and IGF2 in ovarian cancer tissues versus paracancerous tissues show a significantly negative correlation between them. Abbreviation: lv: lentivirus; OC: ovarian cancer. ∗P < 0.05 vs. control (unpaired t-test), ∗∗P < 0.01 vs. control (unpaired t-test).