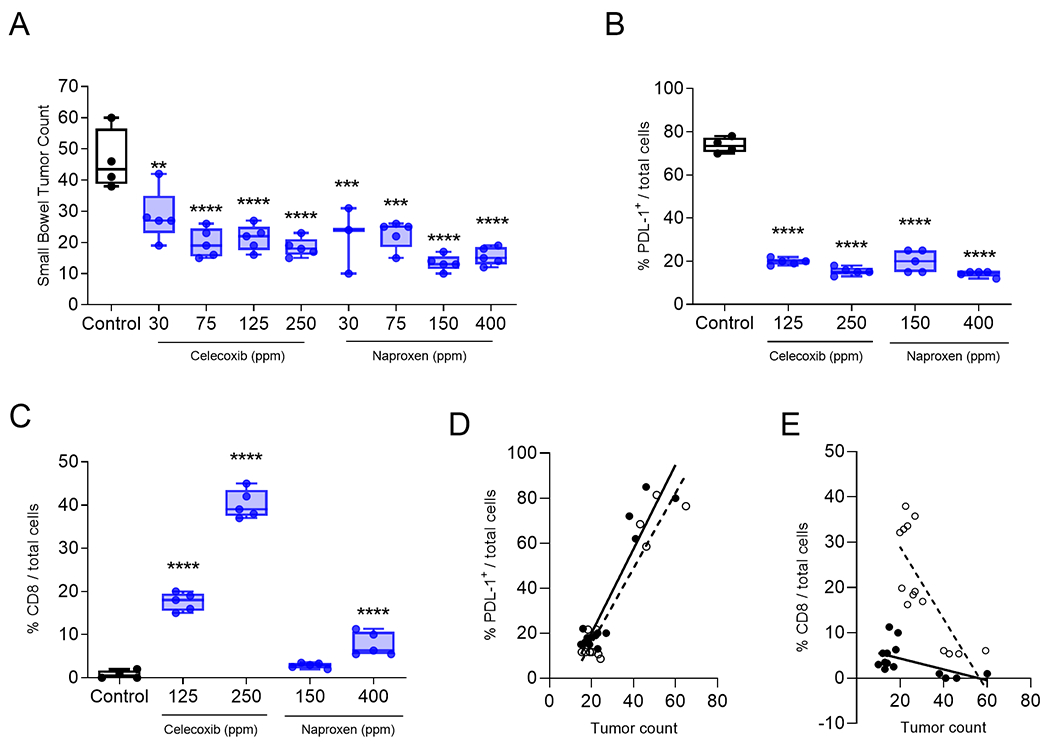
Figure 1.

Treatment with either naproxen or celecoxib significantly inhibited the development of intestinal tumors, decreased tumor PD-L1 expression, and increased infiltrating CD8+ T cells. (A) The number of small bowel tumors after treatment with the indicated dose (parts per million, ppm) of celecoxib or naproxen. Percent (B) PD-L1 or (C) CD8+ T-cells per total cells after treatment with normal chow (control) or chow containing the indicated dose of celecoxib or naproxen. All data are presented as box and whisker plots, horizontal line at median and whiskers minimum to maximum, showing all points. Linear regression of percent (D) PD-L1 or (E) CD8 and tumor count for mice untreated or treated with celecoxib (open circles and dotted line) or naproxen (closed circles and solid line). **p<0.01, ***p<0.001, ****p<0.0001. n=3-5 mice/group.
