Figure 3.

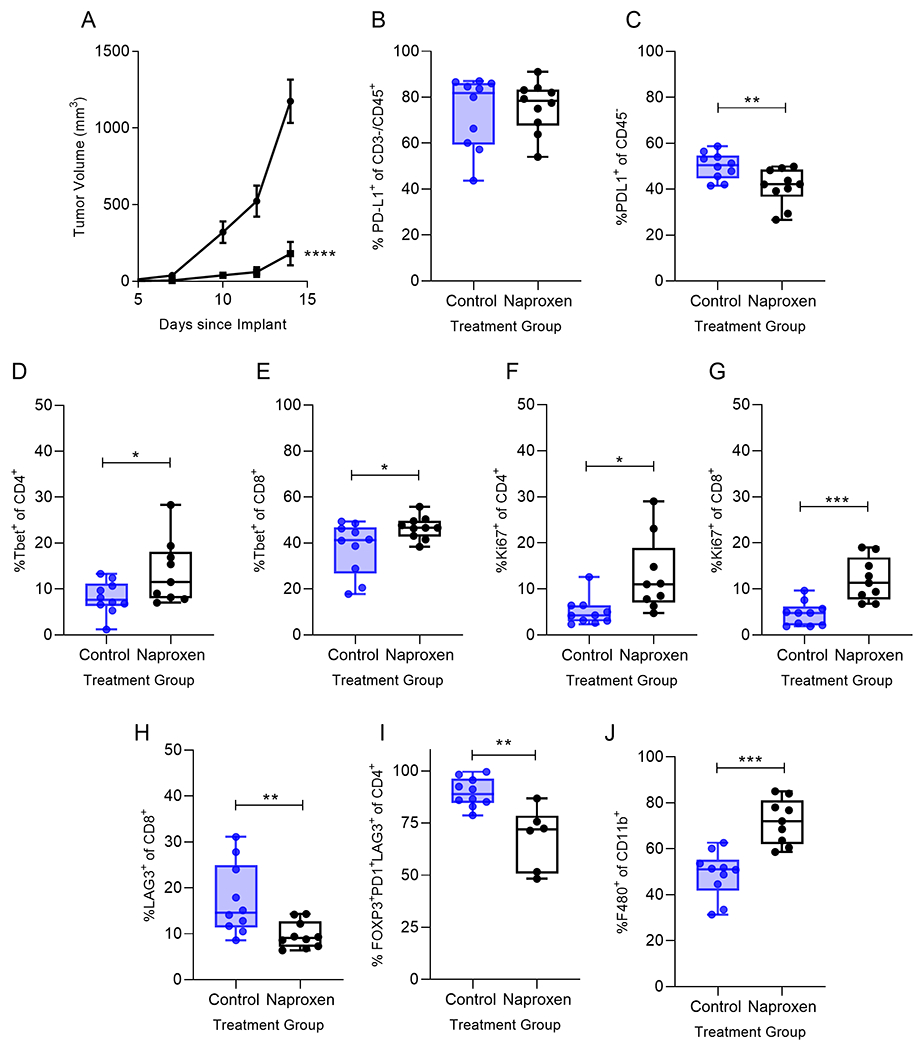
Naproxen treatment inhibited the growth of MC38 in vivo and increased the influx of activated Tbet+ tumor infiltrating lymphocytes. (A) Tumor volume of mice treated with control diet (●) or diet containing 400 ppm Naproxen (■); n=10 mice/group; ****p<0.0001. Percent of infiltrating (B) CD45+CD3-PD-L1+ (C) CD45−PD-L1+, (D) Tbet+CD4+ (E) Tbet+CD8+, (F) Ki67+CD4+, (G) Ki67+CD8+, (H) LAG3+CD8+ (I) CD4+FOXP3+PD-1+LAG3+ and (J) F480+CD11b+ for the indicated treatment group presented as box and whisker plots, horizontal line at median and whiskers minimum to maximum, showing all points. *p<0.05; **p<0.01; ***p<0.001 n=6-10 mice/group.
