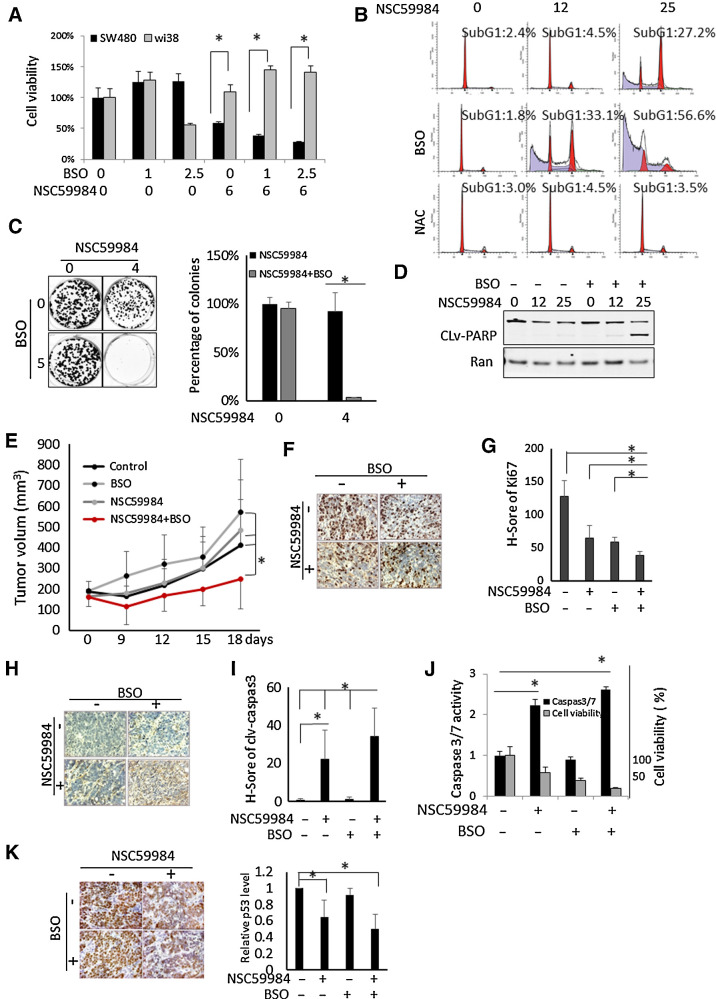
Figure 6.
NSC59984 in combination with BSO suppresses tumor growth. A, Cell viability of SW480 and normal WI-38 cells treated with NSC59984 (μmol/L) and BSO (μmol/L) for 72 hours. B, The cell-cycle profiles of SW480 cells treated with NSC59984 (μmol/L) in combination with NAC (10 mmol/L) or BSO (10 μmol/L) for 72 hours. C, The colony formation in HT29 cancer cells upon NSC59984 treatment in combination with BSO (5 μmol/L) as described in the Materials and Methods. D, Cleaved-PARP in SW480 cells treated with NSC59984 (μmol/L) and BSO (10 μmol/L) for 36 hours. E, Tumor volumes of HT29 xenografts in mice (n = 8). Tumor volumes were measured by a caliper every 3 days. Data are expressed as mean ± SD. *, P < 0.05. F, IHC staining for Ki67 in HT29 xenografted colorectal cancer tumors. G, The H-Score of Ki67 in HT29 xenograft tumors. H, IHC staining for cleaved-caspase 3 in HT29 xenograft tumors. I, The H-Score of cleaved caspase 3 in HT29 xenograft tumors. The H-Score (G and I) was calculated and analysis with VECTRA 2.0 as described in the Materials and Methods. J, Caspase 3/7 activity assays in SW480 cells. The cells were treated with NSC5994 (25 μmol/L) and BSO (10 μmol/L) for 30 hours for the caspase assay and 72 hours for the cell viability assay. The caspase 3/7 activity was normalized to the DMSO treatment as control. The cell viability was normalized to the cells treated with DMSO as control. Data are expressed as mean ± SD. *, P < 0.05. K, IHC staining for mutant p53 in HT29 xenografted tumors. The relative mutant p53 protein level was analyzed by image J and normalized to the nontreatment control. Data are expressed as mean ± SD. *, P < 0.05.

