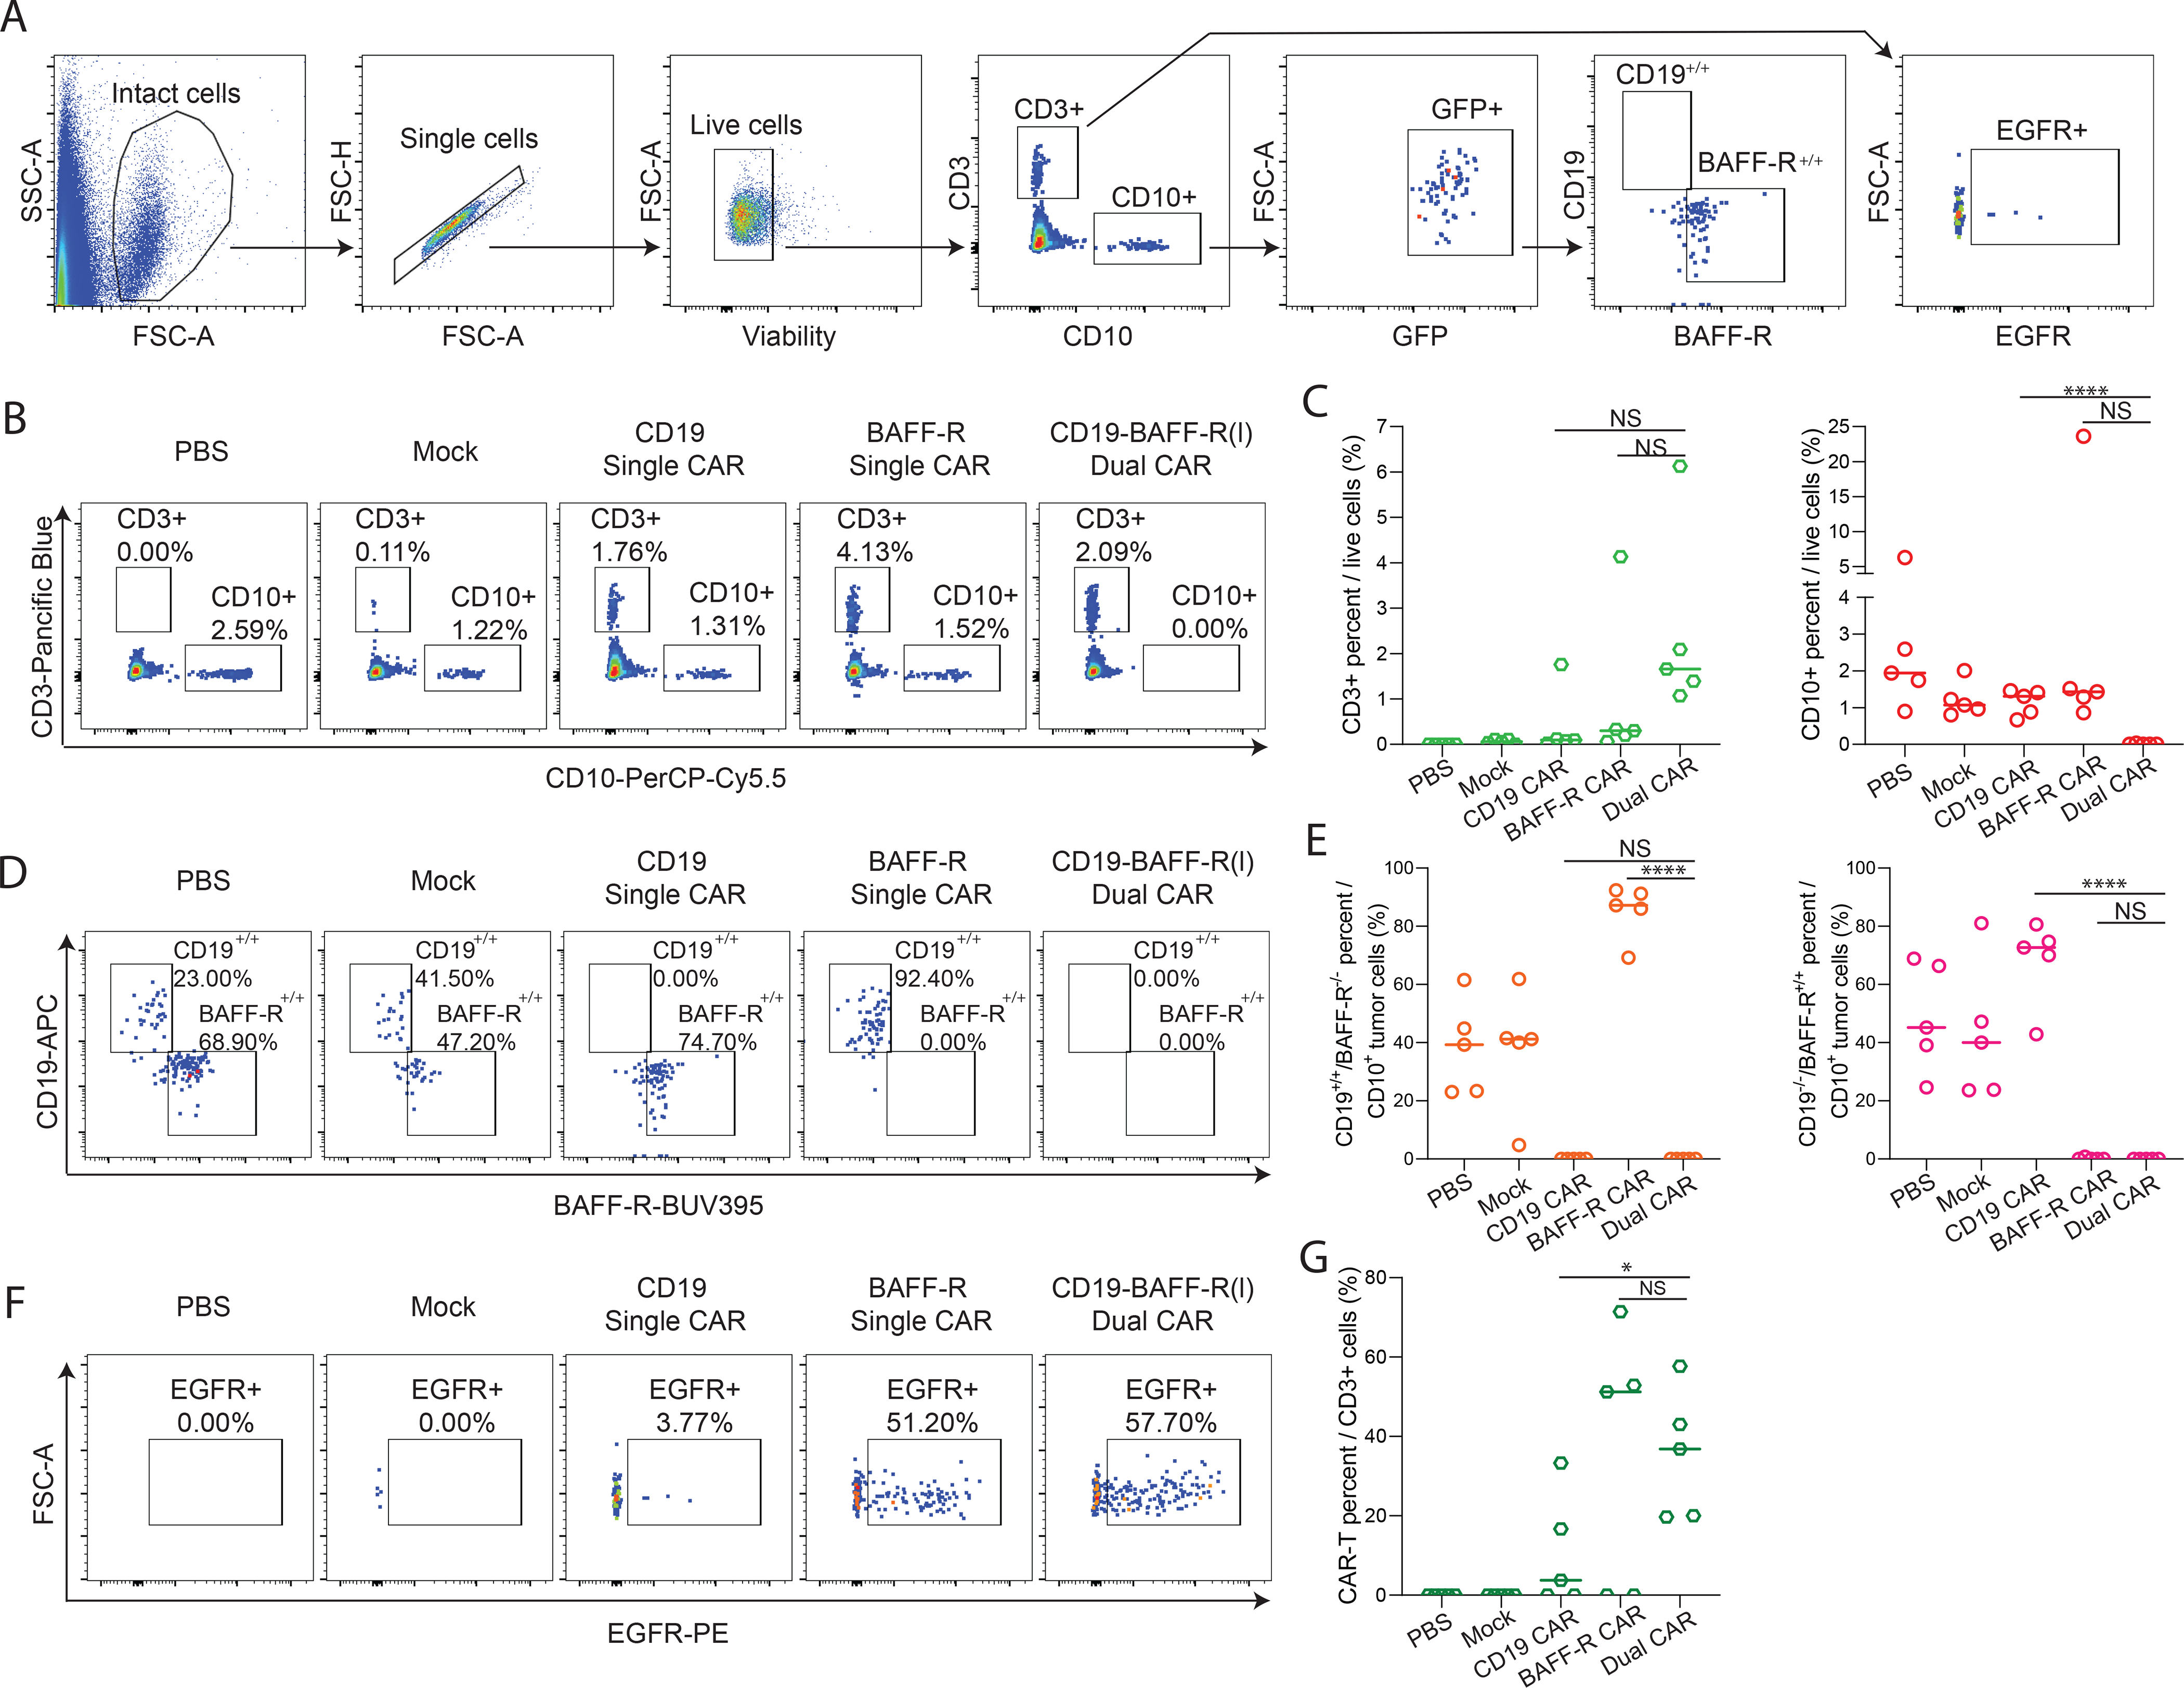
Figure 5. Analysis of residual tumor and CAR T cells in mouse peripheral blood.

Blood was collected 46–50 days post tumor challenge and analyzed with multicolor flow cytometry. A. FACS plots depict the gating strategy used to identify CAR-T and tumor cells in mouse peripheral blood. Viable singlets were gated for CD3+ EGFR+ CAR-T cells and CD10+ tumor cells. B. FACS plots of CD3+ T cell or CD10+ tumor cells in PBS, Mock, CD19 Single CAR, BAFF-R Single CAR and CD19-BAFF-R (l) Dual CAR treated mouse blood. One mouse is displayed as representative of each cohort. C. The dot graph shows the cumulative data of CD3+ T cell or CD10+ tumor cells from five mice in each cohort. Data were analyzed by a Student’s t-test; ****P<0.0001, NS, not significant. D. Lineage analysis of tumor cells for CD19 and BAFF-R expression based off CD10 gating in PBS, Mock, BAFF-R single CAR, CD-19 single CAR, and CD19-BAFF-R(l) Dual CAR groups. E. Cumulative data of CD19 and BAFF-R expression from five mice in each cohort are presented. Data were analyzed by a Student’s t-test; ****P<0.0001, NS, not significant. F. Percentages of CAR (EGFR) T cells from CD3 gate are depicted from one representative mouse. FACS analysis plots from one representative mouse are displayed for each cohort. E. Cumulative data of CAR T cells from 5 mice per cohort are presented. Data were analyzed by a Student’s t-test; *P<0.05, NS: not statistically significant.
