Figure 2.
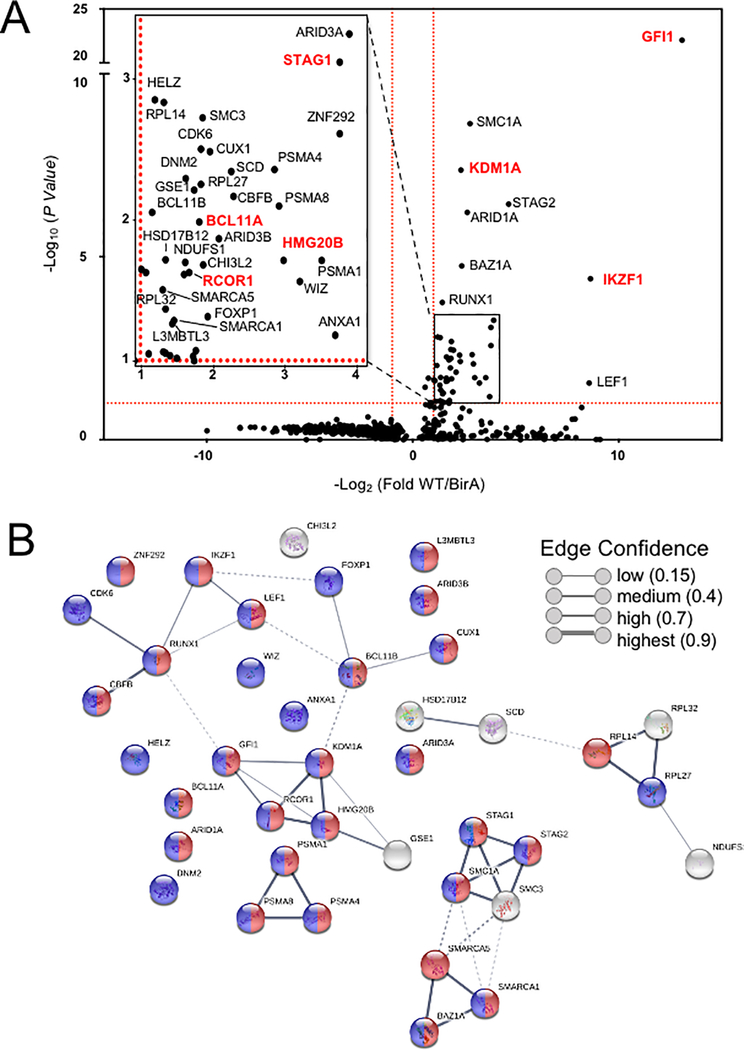
Top hits of GFI1 proximal partners identified by proteome-wide BioID labeling. (A) Volcano plot of proteins identified by BioID proximity labeling. Thresholds (red dashed lines) were fold-difference >2 and P-value <0.05. (Inset) Magnified portion of (A) depicting significant hits. Known GFI1 partners and GFI1 itself are labeled in red. (B) Genes labeled in (A) were subjected to STRING (version 10.5) functional protein association network analysis. Edges represent protein—protein associations. Blue indicates annotated nuclear proteins. Red indicates annotated proteins associated with gene regulation. The network was clustered using the MCL algorithm with inflation parameter 3. Dotted line indicates the proteins belong to different clusters.

