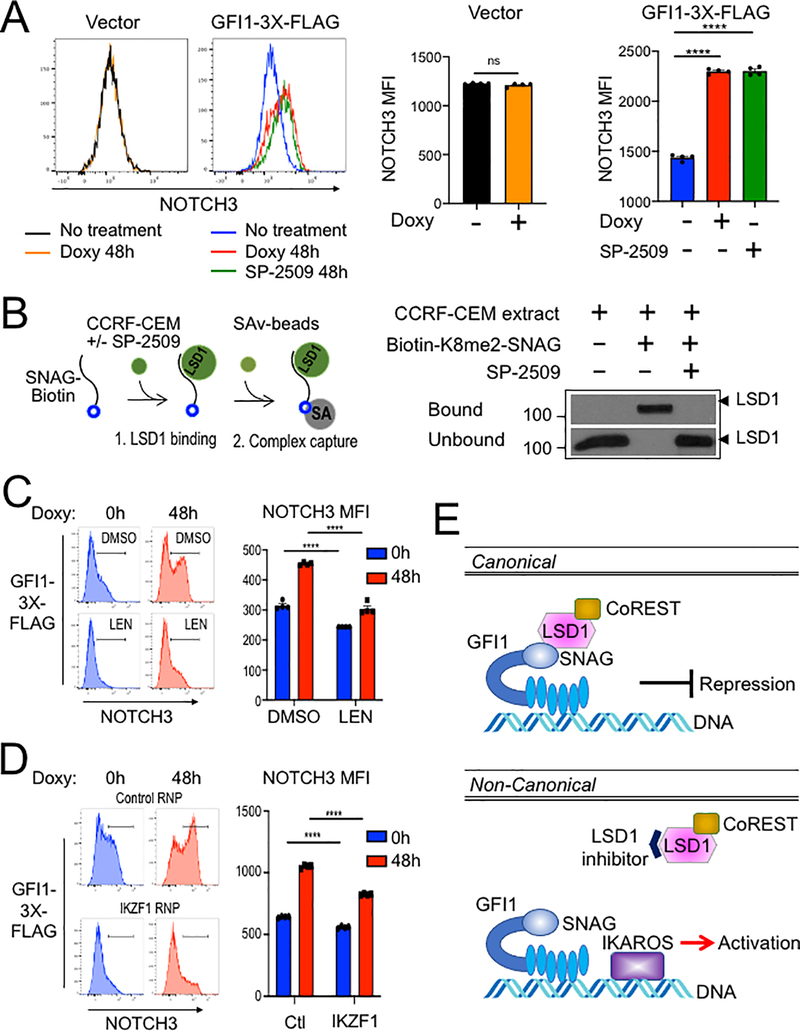
Figure 7.
(A) Flow cytometry for NOTCH3 cell surface expression in SUP-T1cells transduced with vector or GFI1–3×FLAG inducible vectors and treated without or with doxycycline (Doxy), and SP-2509 for 48 hr. Left: representative NOTCH3 flow cytometry. Right: NOTCH3 MFIs were averaged from four independent experiments and plotted as a bar graph. Error bars depict SEM. An unpaired T-test was used for statistical analysis. In each bar graph, values for each independent test are represented by closed shapes. (B) SP-2509 abolishes the SNAG—LSD1 interaction. Biotinylated SNAG peptide demethylated at K8 was added to CCRF-CEM cell extracts with or without SP-2509 and incubated for 1hr prior to addition of streptavidin-Sepharose beads to collect biotinylated peptide and bound LSD1. LSD1 in the bound and unbound fractions were visualized by western blot using anti-LSD1 antibody. (C) Flow cytometry of CCRF-CEM-GFI1–3×FLAG cells pretreated with DMSO or 2 μM lenalidomide (LEN) for 16 hr before treatment with doxycycline for 48 hr. DMSO or Lenalidomide was present continuously. Left: example NOTCH3 flow cytometry. Right: MFIs within the NOTCH3-positive regions shown at left were averaged from four independent experiments and plotted as a bar graph. Bar color corresponds to histogram shading on the left. Error bars depict SEM. Error bars depict SEM. Two-way ANOVA was used for statistical analysis. (D) Flow cytometry of CCRF-CEM-GFI1–3×FLAG cells electroporated with control RNP or IKZF1 RNPs as in Figure 5A. Cells were treated with doxycycline for 0 or 48 hr. Left: example NOTCH3 flow cytometry. Right: MFIs within the NOTCH3-positive regions shown on the left were averaged from four independent experiments and plotted as a bar graph. Error bars depict SEM. Two-way ANOVA was used for statistical analysis. (E) A proposed model for GFI1-mediated non-canonical transcriptional activation. In the well-known canonical transcriptional regulation mechanism, GFI1 acts as a transcriptional repressor by recruiting LSD1/CoREST-containing complexes via its SNAG domain. In non-canonical transcriptional activation, GFI1 activates NOTCH3 and other hallmark T cell developmental genes with IKAROS. DNA binding by both proteins is required, as is an intact SNAG domain not bound by LSD1. An LSD1 inhibitor, which blocks SNAG—LSD1 binding enables transactivation of NOTCH3 and similarly regulated genes via the GFI1—IKAROS partnership.

