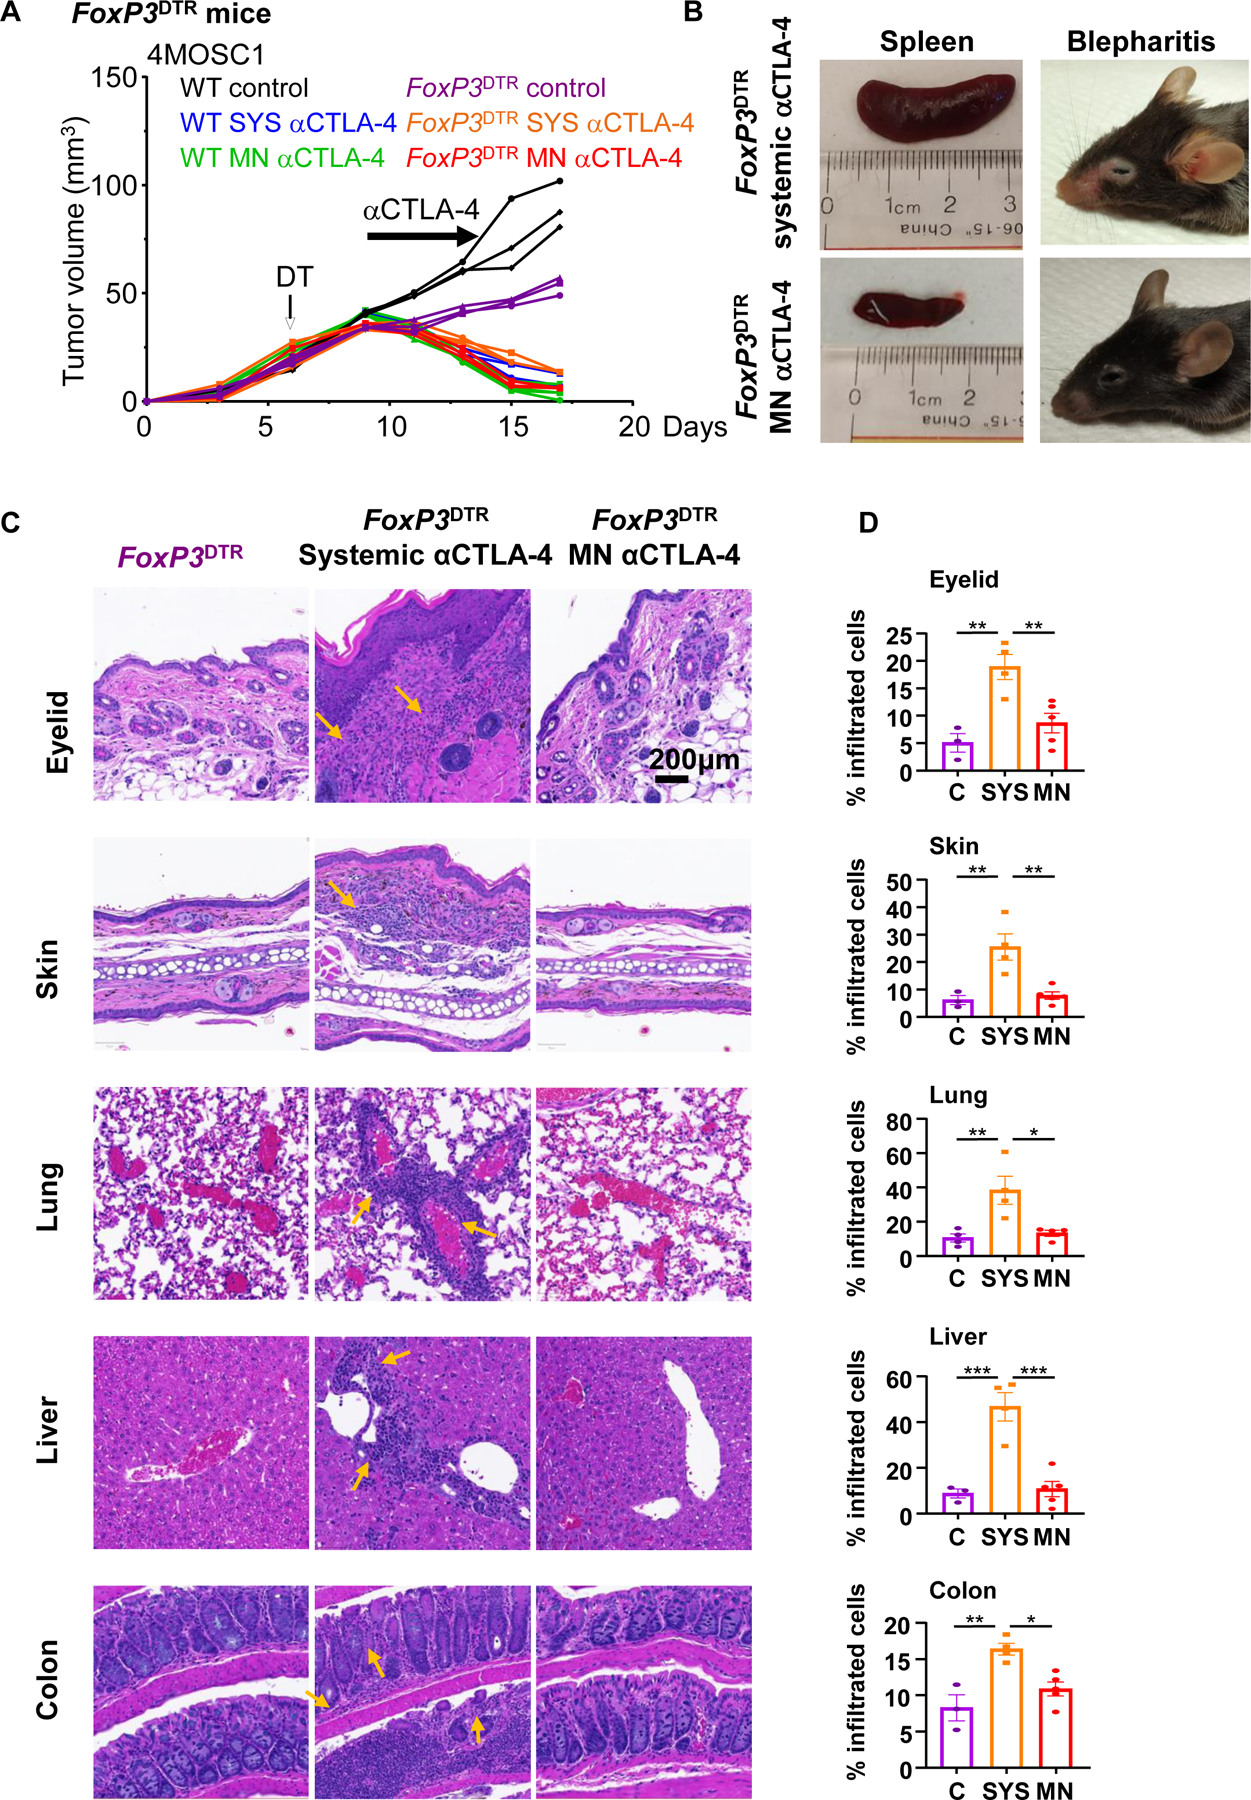
Figure 4.

A) Wild type and FoxP3DTR mice with 4MOSC1 tongue tumors were treated with negative PVP MN (control) or αCTLA-4 systemically (SYS; 5 mg/kg) or locally using MN (0.1mg per patch). FoxP3DTR mice were treated by diphtheria toxin (DT, 500ng) to deplete FoxP3+ Tregs. Individual growth curves of 4MOSC1 tumor-bearing mice plotting primary tumor growth are shown (n = 3 mice per group). B) Representative pictures of spleen and eyes displaying splenomegaly and blepharitis, respectively, from mice in panel A. C) Representative H&E-stained sections of indicated organs from mice in panel A. Areas of inflammation are depicted by yellow arrows. D) Quantification of inflammatory immune cell infiltration in tissue sections from mice in panel A (n=3 mice per group). Data are reported as mean ± SEM; two-sided Student’s t-test; the p-value is indicated where relevant when compared with the control-treated group.
