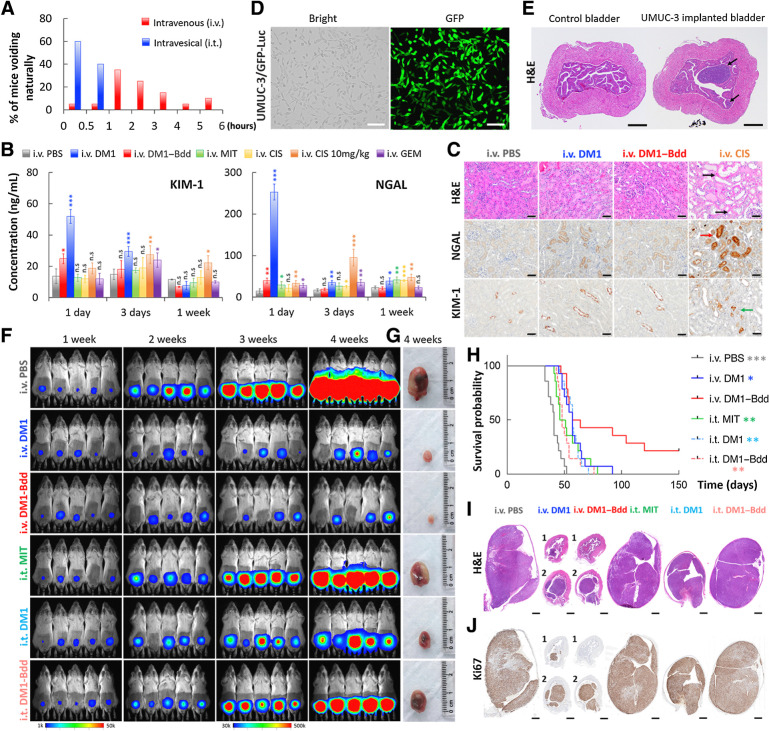
Figure 4.
Therapeutic efficacy of DM1–Bdd in treating bladder cancer. A, Bar chart comparing the time when BALB/cJ mice (n = 20/group) needed to void naturally following intravenous or intravesical administration of PBS (80 μL). The bladders were emptied prior to starting the experiment. Each animal was isolated for monitoring the urination pattern. B, Comparing the nephrotoxicity of DM1–Bdd to other chemotherapeutics. Bar chart showing the concentrations of renal injury biomarkers, NGAL and KIM-1, in urine collected from animals 1, 3, and 7 days after treatment with PBS, DM1 (0.75 mg/kg), DM1–Bdd (0.75 mg/kg of drug content), MIT (0.75 mg/kg), CIS (0.75 mg/kg), CIS (10 mg/kg), or GEM (0.75 mg/kg) via tail-vein injection (150 μL). Student t test; *, P < 0.05; **, P < 0.01; ***, P < 0.001. C, Immunochemical staining for NGAL and KIM-1 was also performed. Representative microscopic images of kidney sections from BALB/cJ mice intravenously administered with PBS (150 μL), DM1 (0.75 mg/kg, 150 μL), DM1–Bdd (0.75 mg/kg of drug content, 150 μL), or CIS (10 mg/kg, 150 μL) as a positive control. The organs were harvested 3 days after the drug treatments and stained with H&E. Black arrows indicate the multifocal degeneration of the tubular epithelium after treatment with CIS. Red and green arrows indicate renal tubular epithelial cells immunoreactive for NGAL and KIM-1, respectively, following CIS treatment. Scale bar, 50 μm. D, Brightfield and fluorescence images of UMUC-3/GFP-Luc cells that were stably transduced with a lentivirus carrying both GFP and firefly luciferase genes. Scale bar, 80 μm. E, Orthotopic xenograft model. Representative image of bladders collected from female NSG mice (n = 3) 1 week after implantation of UMUC-3/GFP-Luc cells (4 × 10⁴ cells/animal). Black arrows, tumors growing in the lamina propia. Scale bar, 500 μm. F, Representative merged bioluminescence/brightfield images of the tumor-bearing NSG mice after weekly treatments with intravenous PBS (150 μL), intravenous DM1 (0.75 mg/kg, 150 μL), intravenous DM1–Bdd (0.75 mg/kg of drug content, 150 μL), intravesical MIT (1 mg/mL, 50 μL), intravesical DM1 (0.75 mg/kg, 50 μL), or intravesical DM1–Bdd (0.75 mg/kg, 50 μL) for 3 weeks (n = 10/group). Images were acquired every week to monitor and compare tumor growth in each treatment group. G, Representative pictures of bladders excised from each animal group (additional recruitment of n = 3/treatment group) 1 week after completing the treatment cycles. H, Kaplan–Meier cumulative survival plot of animals administered with different drugs (n = 14/group). The significant differences in survival between the animals treated with intravenous DM1–Bdd and the other groups was evaluated using the Mantel–Cox log-rank test and the Benjamini and Hochberg adjusted P values. I and J, Representative image(s) of bladder sections from the animals in each treatment group (n = 3/group). The organs were harvested at the end of the 3-week treatment and then paraffin-embedded, sectioned, and stained with H&E (I) and Ki67 (proliferation marker; J).

