. 2022 Jan 17;82(7):1409–1422. doi: 10.1158/0008-5472.CAN-21-2897

Figure 5.

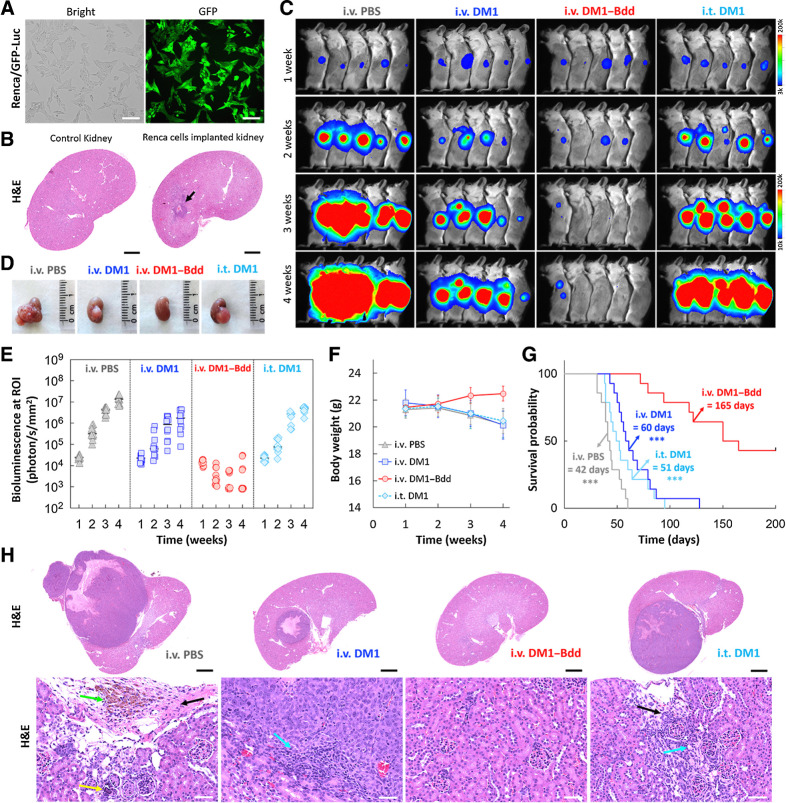
Figure 5. Therapeutic efficacy of DM1–Bdd in treating renal carcinoma. A, Brightfield and fluorescence images of Renca cells that were stably transduced with a lentivirus carrying both GFP and firefly luciferase genes. Scale bar, 80 μm. B, Syngeneic xenograft model. Representative image of the histologic analysis of kidneys collected from female BALB/cJ mice (n = 3) 1 week after implantation of murine Renca cells (4 × 10³ cells/animal) in the renal capsules (black arrow). Scale bar, 1 mm. C, Representative merged bioluminescence/brightfield images of BALB/cJ mice bearing Renca/GFP-Luc tumors after treatment with intravenous PBS (150 μL), intravenous DM1 (0.75 mg/kg, 150 μL), intravenous DM1–Bdd (0.75 mg/kg of drug content, 150 μL), or intravesical DM1 (0.75 mg/kg, 50 μL) weekly for 3 weeks (n = 10/group). D, Representative photos of the kidneys excised from the animals after completion of the treatment cycle (additional n = 4/group). E–G, Longitudinal comparisons of bioluminescence signals at the region of interest (ROI = kidney; E), body weight (F), and survival (G) among animals receiving different treatments (n = 14/group). The significant differences in survival between animals treated with intravenous DM1–Bdd and the drugs was evaluated using the Mantel–Cox log-rank test and the Benjamini and Hochberg adjusted P values. ***, P < 0.001. H, Representative kidney sections from animals of each treatment group (additional n = 4/group). The sections were stained with H&E. The green, yellow, black, and blue arrows indicate the presence of pigment-laden macrophage, focal mineralization, interstitial fibrosis, and mononuclear cell infiltrates, respectively. Scale bars, 2 mm and 50 μm.

Therapeutic efficacy of DM1–Bdd in treating renal carcinoma. A, Brightfield and fluorescence images of Renca cells that were stably transduced with a lentivirus carrying both GFP and firefly luciferase genes. Scale bar, 80 μm. B, Syngeneic xenograft model. Representative image of the histologic analysis of kidneys collected from female BALB/cJ mice (n = 3) 1 week after implantation of murine Renca cells (4 × 10³ cells/animal) in the renal capsules (black arrow). Scale bar, 1 mm. C, Representative merged bioluminescence/brightfield images of BALB/cJ mice bearing Renca/GFP-Luc tumors after treatment with intravenous PBS (150 μL), intravenous DM1 (0.75 mg/kg, 150 μL), intravenous DM1–Bdd (0.75 mg/kg of drug content, 150 μL), or intravesical DM1 (0.75 mg/kg, 50 μL) weekly for 3 weeks (n = 10/group). D, Representative photos of the kidneys excised from the animals after completion of the treatment cycle (additional n = 4/group). EG, Longitudinal comparisons of bioluminescence signals at the region of interest (ROI = kidney; E), body weight (F), and survival (G) among animals receiving different treatments (n = 14/group). The significant differences in survival between animals treated with intravenous DM1–Bdd and the drugs was evaluated using the Mantel–Cox log-rank test and the Benjamini and Hochberg adjusted P values. ***, P < 0.001. H, Representative kidney sections from animals of each treatment group (additional n = 4/group). The sections were stained with H&E. The green, yellow, black, and blue arrows indicate the presence of pigment-laden macrophage, focal mineralization, interstitial fibrosis, and mononuclear cell infiltrates, respectively. Scale bars, 2 mm and 50 μm.