Figure 6.
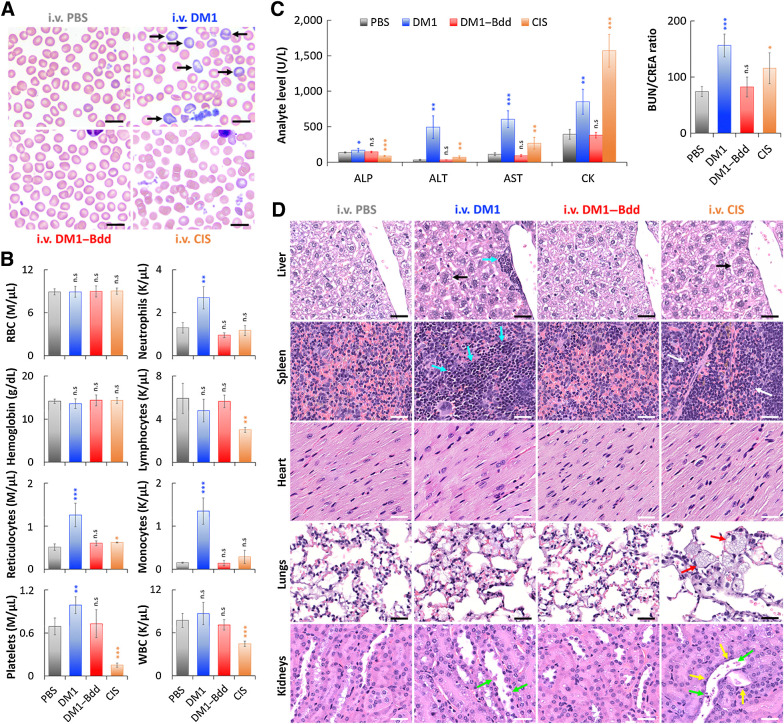
DM1–Bdd displays a safe toxicity profile. A, Representative microscopic images of blood smears collected from female BALB/cJ mice after intravenous administration of PBS (150 μL), DM1 (0.75 mg/kg, 150 μL), DM1–Bdd (0.75 mg/kg of drug content, 150 μL), or CIS (10 mg/kg, 150 μL) as a positive control, weekly for 3 weeks. Black arrows, polychromatophilic macrocytes. Scale bar, 10 μm. B, Selected hematologic results obtained 1 week after completing the different treatment courses. RBC, red blood cells; WBC, white blood cells. Student t test; *, P < 0.05; **, P < 0.01; ***, P < 0.001. C, Comparison of selected serum biochemical analytes, including liver enzyme activity (ALP, ALT, and AST), muscle enzyme activity (AST and CK), and clearance of nitrogenous waste (BUN/CREA ratio). ALP, alkaline phosphatase; ALT, alanine aminotransferase; AST, aspartate aminotransferase; CK, creatine kinase; BUN, blood urea nitrogen; CREA, creatinine. D, Histopathologic analysis of the major organs (liver, spleen, heart, lungs, and kidneys) from animals administered with the different drug treatments. Black arrows indicate the increased of hepatocyte mitotic activity in liver. Blue arrows show the enhanced hepatic and splenic EMH. The area in between the white arrows indicates depletions of erythrocytes and EMH elements in the red pulp of the spleen. Red arrows highlight the presence of large and foamy macrophages in the alveoli. Yellow and green arrows indicate flattened renal tubular cells and necrotic sloughed debris of dying cells contained within the lumen, respectively. Scale bar, 30 μm.

