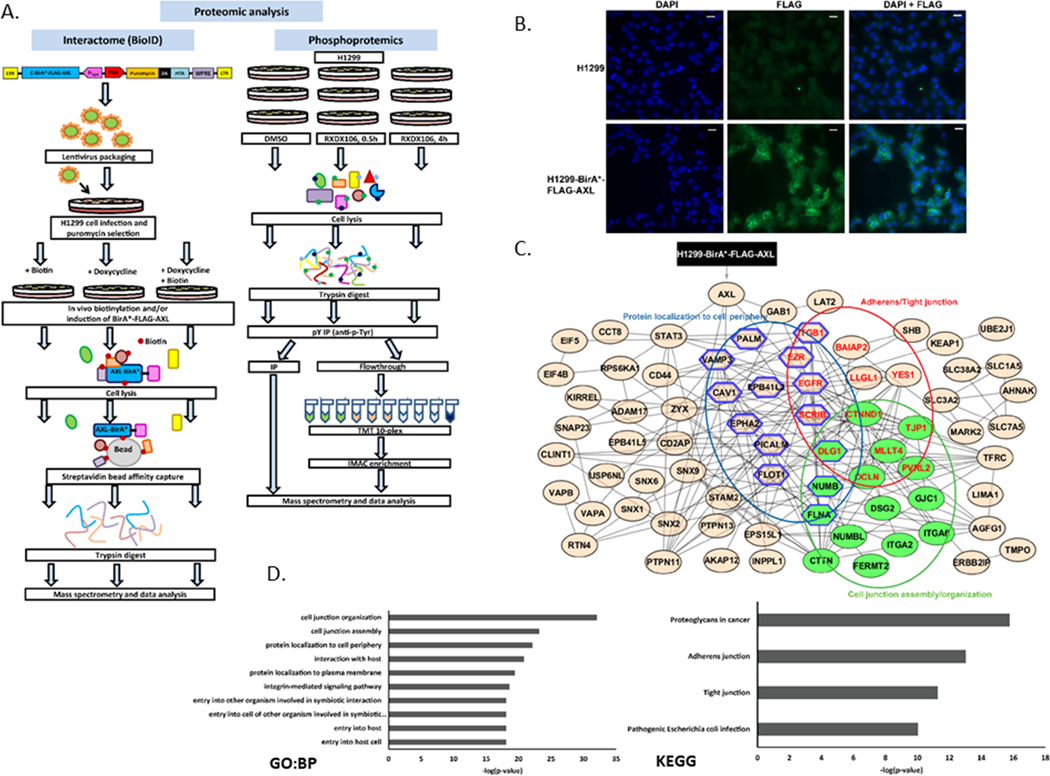
Figure 1. Proteomic characterization of the AXL interactome.
(A) Schematic of the workflow integrating multiple proteomics approaches (BioID, tyrosine and global phosphoproteomics). (B) Immunofluorescence staining showing expression of FLAG in H1299 cells with or without the pSTV6-BirA*-FLAG-AXL transgene. Images were acquired at 20X. DAPI nuclear stain: blue; FLAG: green. (C) STRING network of AXL interacting proteins as identified via BioID pulldowns followed by APOSTL analysis. Only connected nodes are shown. Nodes are grouped and colored in Cytoscape as per the enrichment analysis shown in (D). Green nodes: cell junction assembly/organization; blue hexagon: protein localization to cell periphery; red labels: Adherens/tight junction. (D) Gene Ontology (GO)- Biological Process (BP) and KEGG enrichment analyses of AXL interactome using APOSTL.

