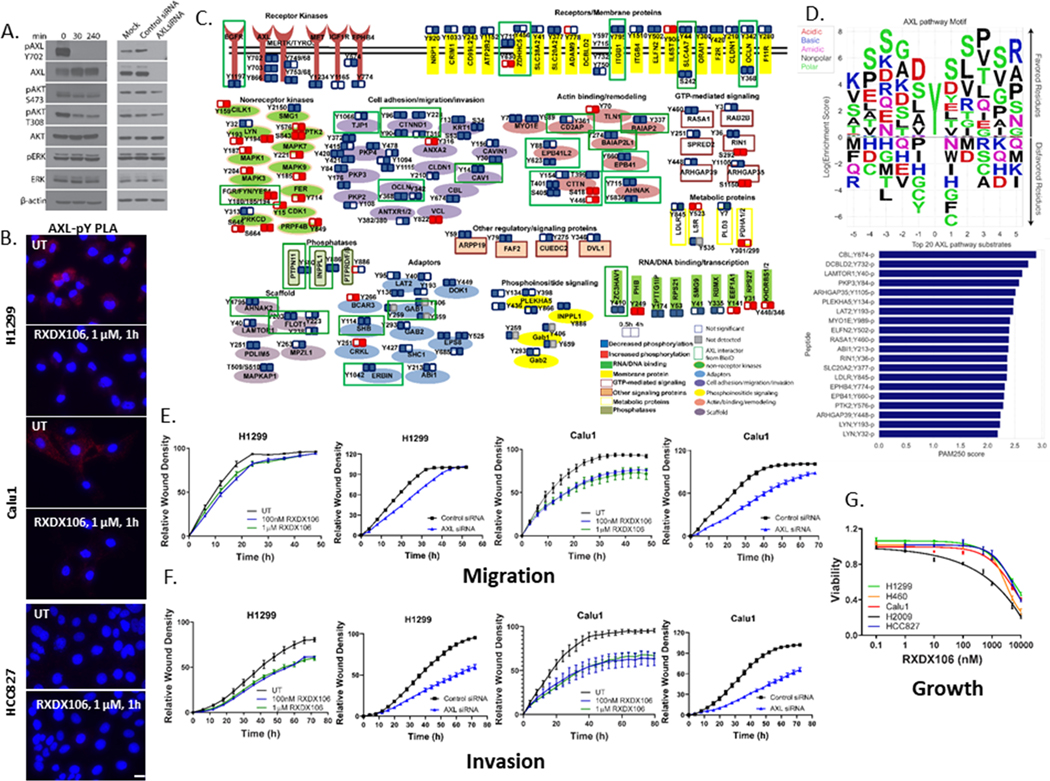
Figure 2. Phosphoproteome responses to AXL inhibition by RXDX106 in H1299 lung cancer cells.
(A) Immunoblot analysis of downstream signaling in H1299 after treatment either with 100 nM RXDX106 for the indicated times or AXL siRNA for 48h. Shown is a representative of three replicate experiments (B) Proximity ligation assay for AXL-pY complexes in the indicated cell lines with or without exposure to 1 μM RXDX106 for 1h. Images were acquired at 40X magnification. Shown is a representative of two replicate experiments (C) Overview of proteins modulated by tyrosine phosphorylation after RXDX106 exposure, grouped according to their cellular function. Each functional group is represented by a different color/shape as shown in the legend (D) Peptide sequences of proteins from the pY dataset that overlapped with the BioID data were used to build a Position-Specific-Scoring-Matrix (PSSM) AXL pathway substrate motif. Also shown are the top 20 putative AXL pathway substrates as a function of their mean PAM250 similarity scores (E-F) Scratch wound migration (E) and invasion (F) assays where relative wound density of H1299 and Calu1 cells, treated either with RXDX106 or AXL siRNA, were analyzed on the IncuCyte every 3h until the scratch wound is healed (~48 – 72h). Data is represented as mean ± SE and is representative of three replicate experiments (G) Relative viability of NSCLC cell lines expressing varying levels of phosphorylated and total AXL as assessed by CellTiter-Glo after 72 h of treatment with increasing concentrations of RXDX-106. Data are represented as mean ± SE and is the average of three replicate experiments.

