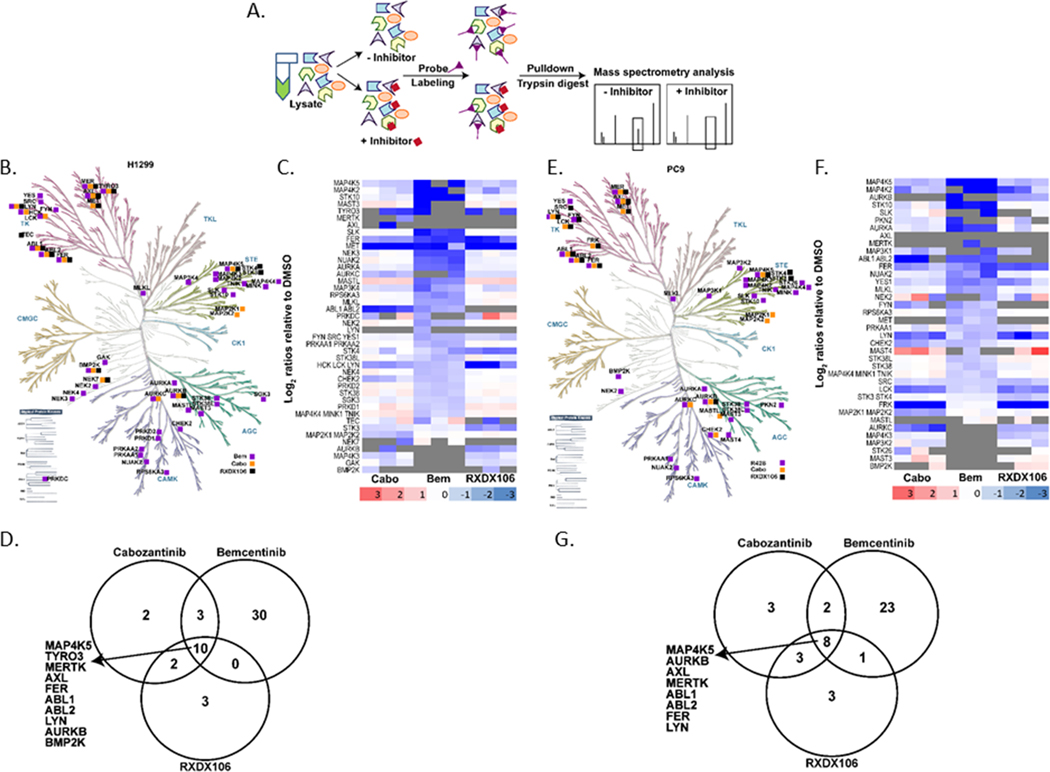
Figure 4. Activity-based protein profiling (ABPP) reveals differential targets of AXL inhibitors.
(A) Schematic representation of ABPP workflow. Kinome trees showing comparative kinase binding profiles of RXDX106, Bemcentinib, and Cabozantinib in H1299 (B) and PC9 (E) cells. Kinome phylogenetic tree adapted courtesy of Cell Signaling Technology. Heatmap representation of log2 ratios relative to DMSO for selected kinase targets for each drug in H1299 (C) and PC9 (F) cells. Venn diagrams representing number of kinase targets for each AXL TKI in H1299 (D) and PC9 (G) cells. Kinases that are common targets for all 3 drugs in each cell linse have been listed.

