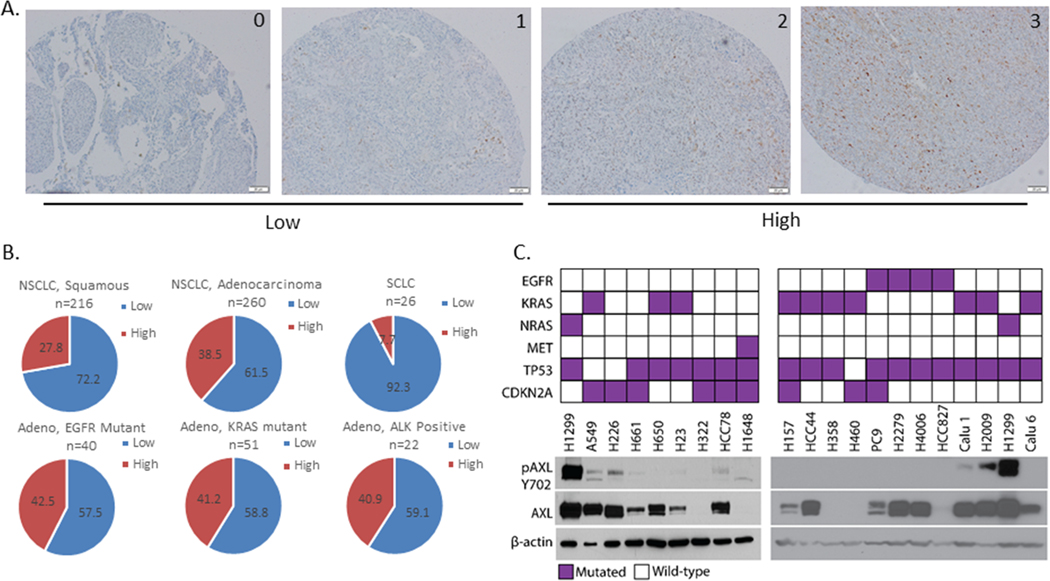
Figure 6. AXL expression in patient tumor specimens and cell lines in lung cancer.
AXL IHC was performed on patient tumor specimens. Staining intensity was graded as 0=none, 1=weak, 2= moderate, and 3=strong. (A) Representative images for each scoring grade, acquired at 20X. (B) Graphs showing distribution of AXL expression in tumor samples of the indicated types. IHC scores were grouped as low (0 or 1) or high (2 or 3). n indicates the number of specimens of the indicated type used for analysis. (C) Immunoblot analysis showing phosphoTyr702- and total AXL protein levels in a panel of NSCLC cell lines. The driver mutation for each cell line is indicated in the top panel. β-actin protein levels were used as a loading control.

