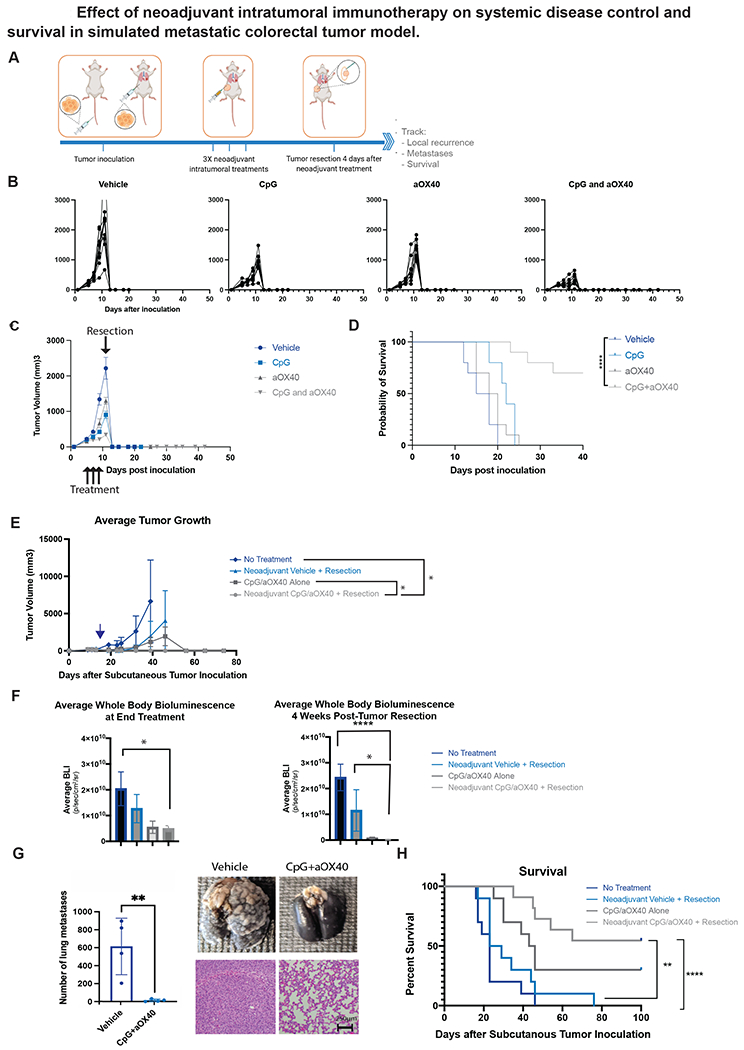
Figure 1.

A-F, H Groups of BALB/c WT mice (n = 10) were inoculated with 5x10⁵ CT26-Luc colorectal carcinoma tumor cells into tail vein followed a day later with inoculation of 5x10⁵ CT26-Luc tumor cells subcutaneously into the right side of the abdomen to simulate metastatic and local disease respectively. Treatment started once local (subcutaneous) tumor reached 0.7cm in diameter. A. Schematic illustrating general experimental timeline. B-D. Groups of mice were treated with intratumoral administration of neoadjuvant immunotherapy (3X injections, 50ug CpG and 8ug aOX40 antibody per injection vs CpG alone vs aOX40 alone vs vehicle (PBS)) followed 4 days later by resection. B. Individual primary tumor growth curves for each treatment group. C. Average local tumor growth in different treatment groups. Data presented as mean tumor size +/− SEM. D. Kaplan-Meier curves for overall survival of each group shown. P values were calculated using the log-rank test (Mantel-Cox). p <0.001. E, F, H. Groups of mice were similarly treated with intratumoral administration of neoadjuvant immunotherapy (3X injections, 50ug CpG and 8ug aOX40 antibody per injection), immunotherapy alone (3X injections of 50ug of CpG and 8ug of aOX40 antibody per injection), neoadjuvant vehicle (PBS) followed by resection or no treatment. Groups that underwent resection did so on day 17 following subcutaneous tumor inoculation. E. Average local tumor growth in different treatment groups. Date of resection indicated by blue arrow. Data presented as mean tumor size +/− SEM. Difference in primary tumor size between groups were significant by unpaired t test. p = 0.03 (No treatment vs Neoadjuvant CpG/aOX40 + Resection). p = 0.02 (CpG/aOX40 alone/Neoadjuvant CpG vs aOX40 + Resection). F. Average systemic bioluminescent signal in different groups on last day of local immunotherapy treatment (n = 10) and at 4 weeks (n =2 in No Treatment group; n=3 in Resection Only; n = 6 in CpG/aOX40 group; n = 9 in Neoadjuvant CpG/aOX40 group) following resection of the primary tumor. Data presented as mean whole body bioluminescence (BLI) +/− SEM. Difference in average whole body bioluminescence at end treatment between groups were significant by unpaired t test. p = 0.03 (No Treatment vs Neoadjuvant CpG/aOX40 + Resection). Difference in average whole body bioluminescence at 4 weeks post tumor resection between groups were also significant by unpaired t test: p < 0.0001 (CpG/aOX40 alone vs Neoadjuvant CpG/aOX40 + Resection). p = 0.02 (CpG/aOX40 Alone vs Neoadjuvant CpG/aOX40 + Resection). G. In a separate experiment, mice in this group similarly inoculated with CT26 and lungs were harvested for examination after neoadjuvant treatment. Figure demonstrates gross burden of systemic disease in mice treated with neoadjuvant vehicle versus Cps/aOX40 at time of primary tumor resection. To detect metastatic pulmonary nodules, lungs were stained with either India ink (top) or H&E (bottom). Graph quantifies the numbers of the metastasis in the lungs. All experiments described above were performed at least twice to confirm findings p = 0.0087 by unpaired t test. H. Kaplan-Meier curves for overall survival of each group shown. P values were calculated using the log-rank test (Mantel-Cox). p < 0.003 (Neoadjuvant CpG/aOX40 + Resection vs Neoadjuvant Vehicle + Resection). p < 0.0001 (Neoadjuvant CpG/aOX40 + Resection vs No Treatment).
