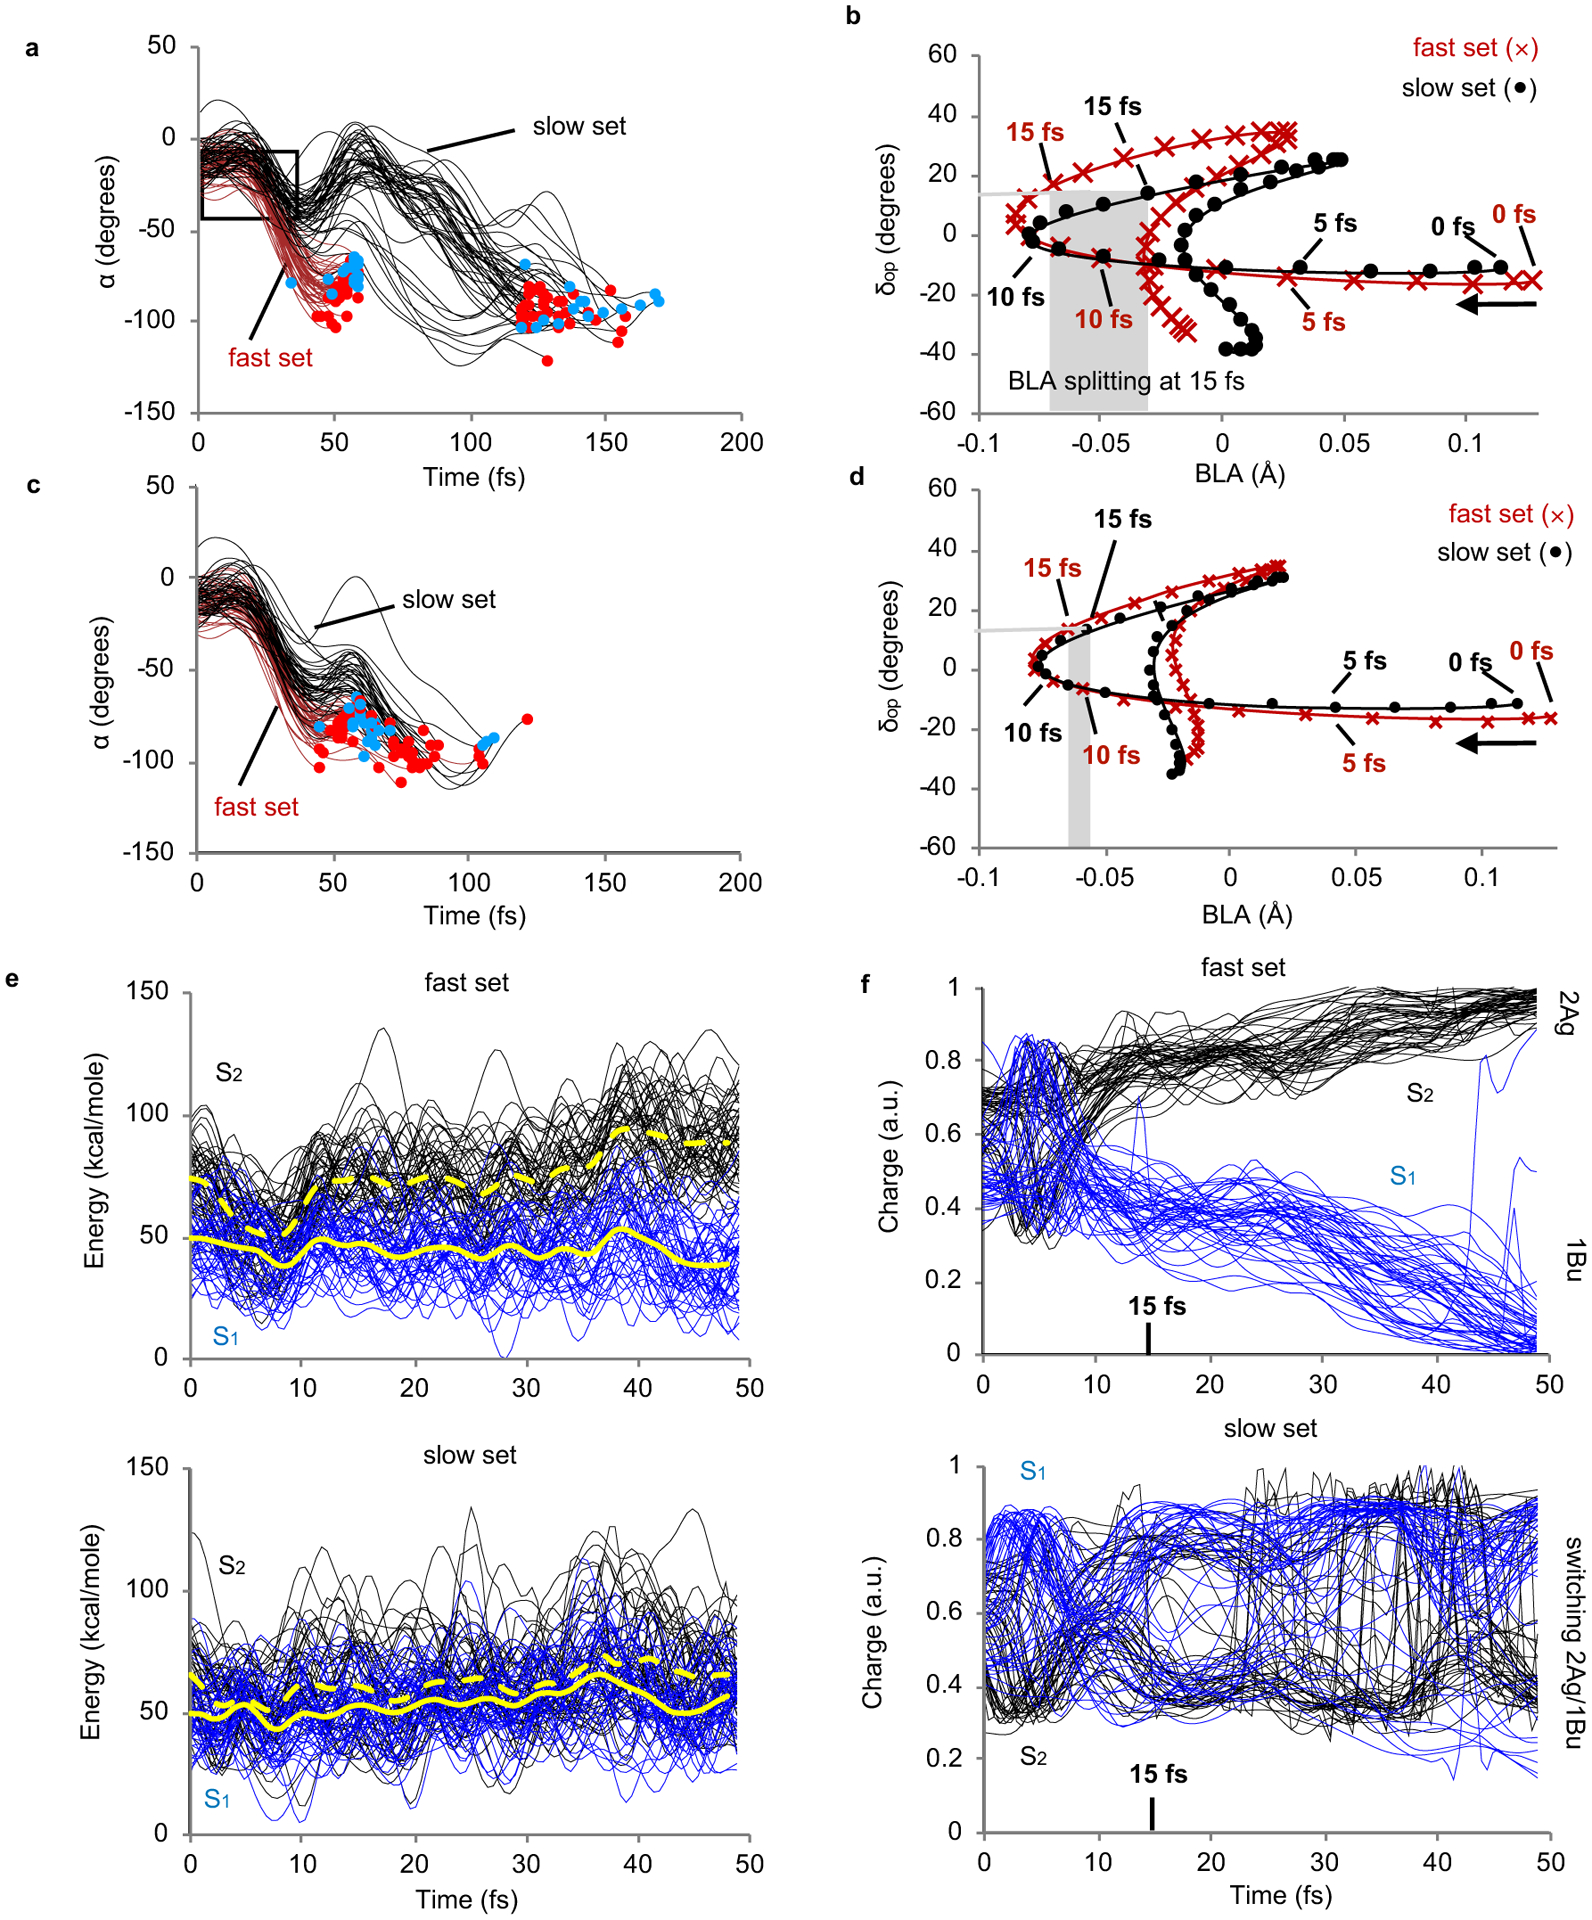
Fig. 3. Analysis of the subpopulation dynamics.

(a) α progression along the fast and slow trajectory sets. The framed region represents the investigated α (−10 to −40 degrees) and time (0–50 fs) window. (b) Progression along the average BLA and δop values for the fast and slow sets. (c) and (d) Same as part A and B but for a Rh model with halved opsin atomic charges. (e) Time evolution of S2 and S1 potential energy profiles for the fast and slow sets. (f) Time evolution of the S2 and S1 charge transfer magnitude for the fast and slow sets. The 1Bu and 2Ag labels refer to the symmetry of the electronic wavefunction of a reference planar all-trans polyene.
