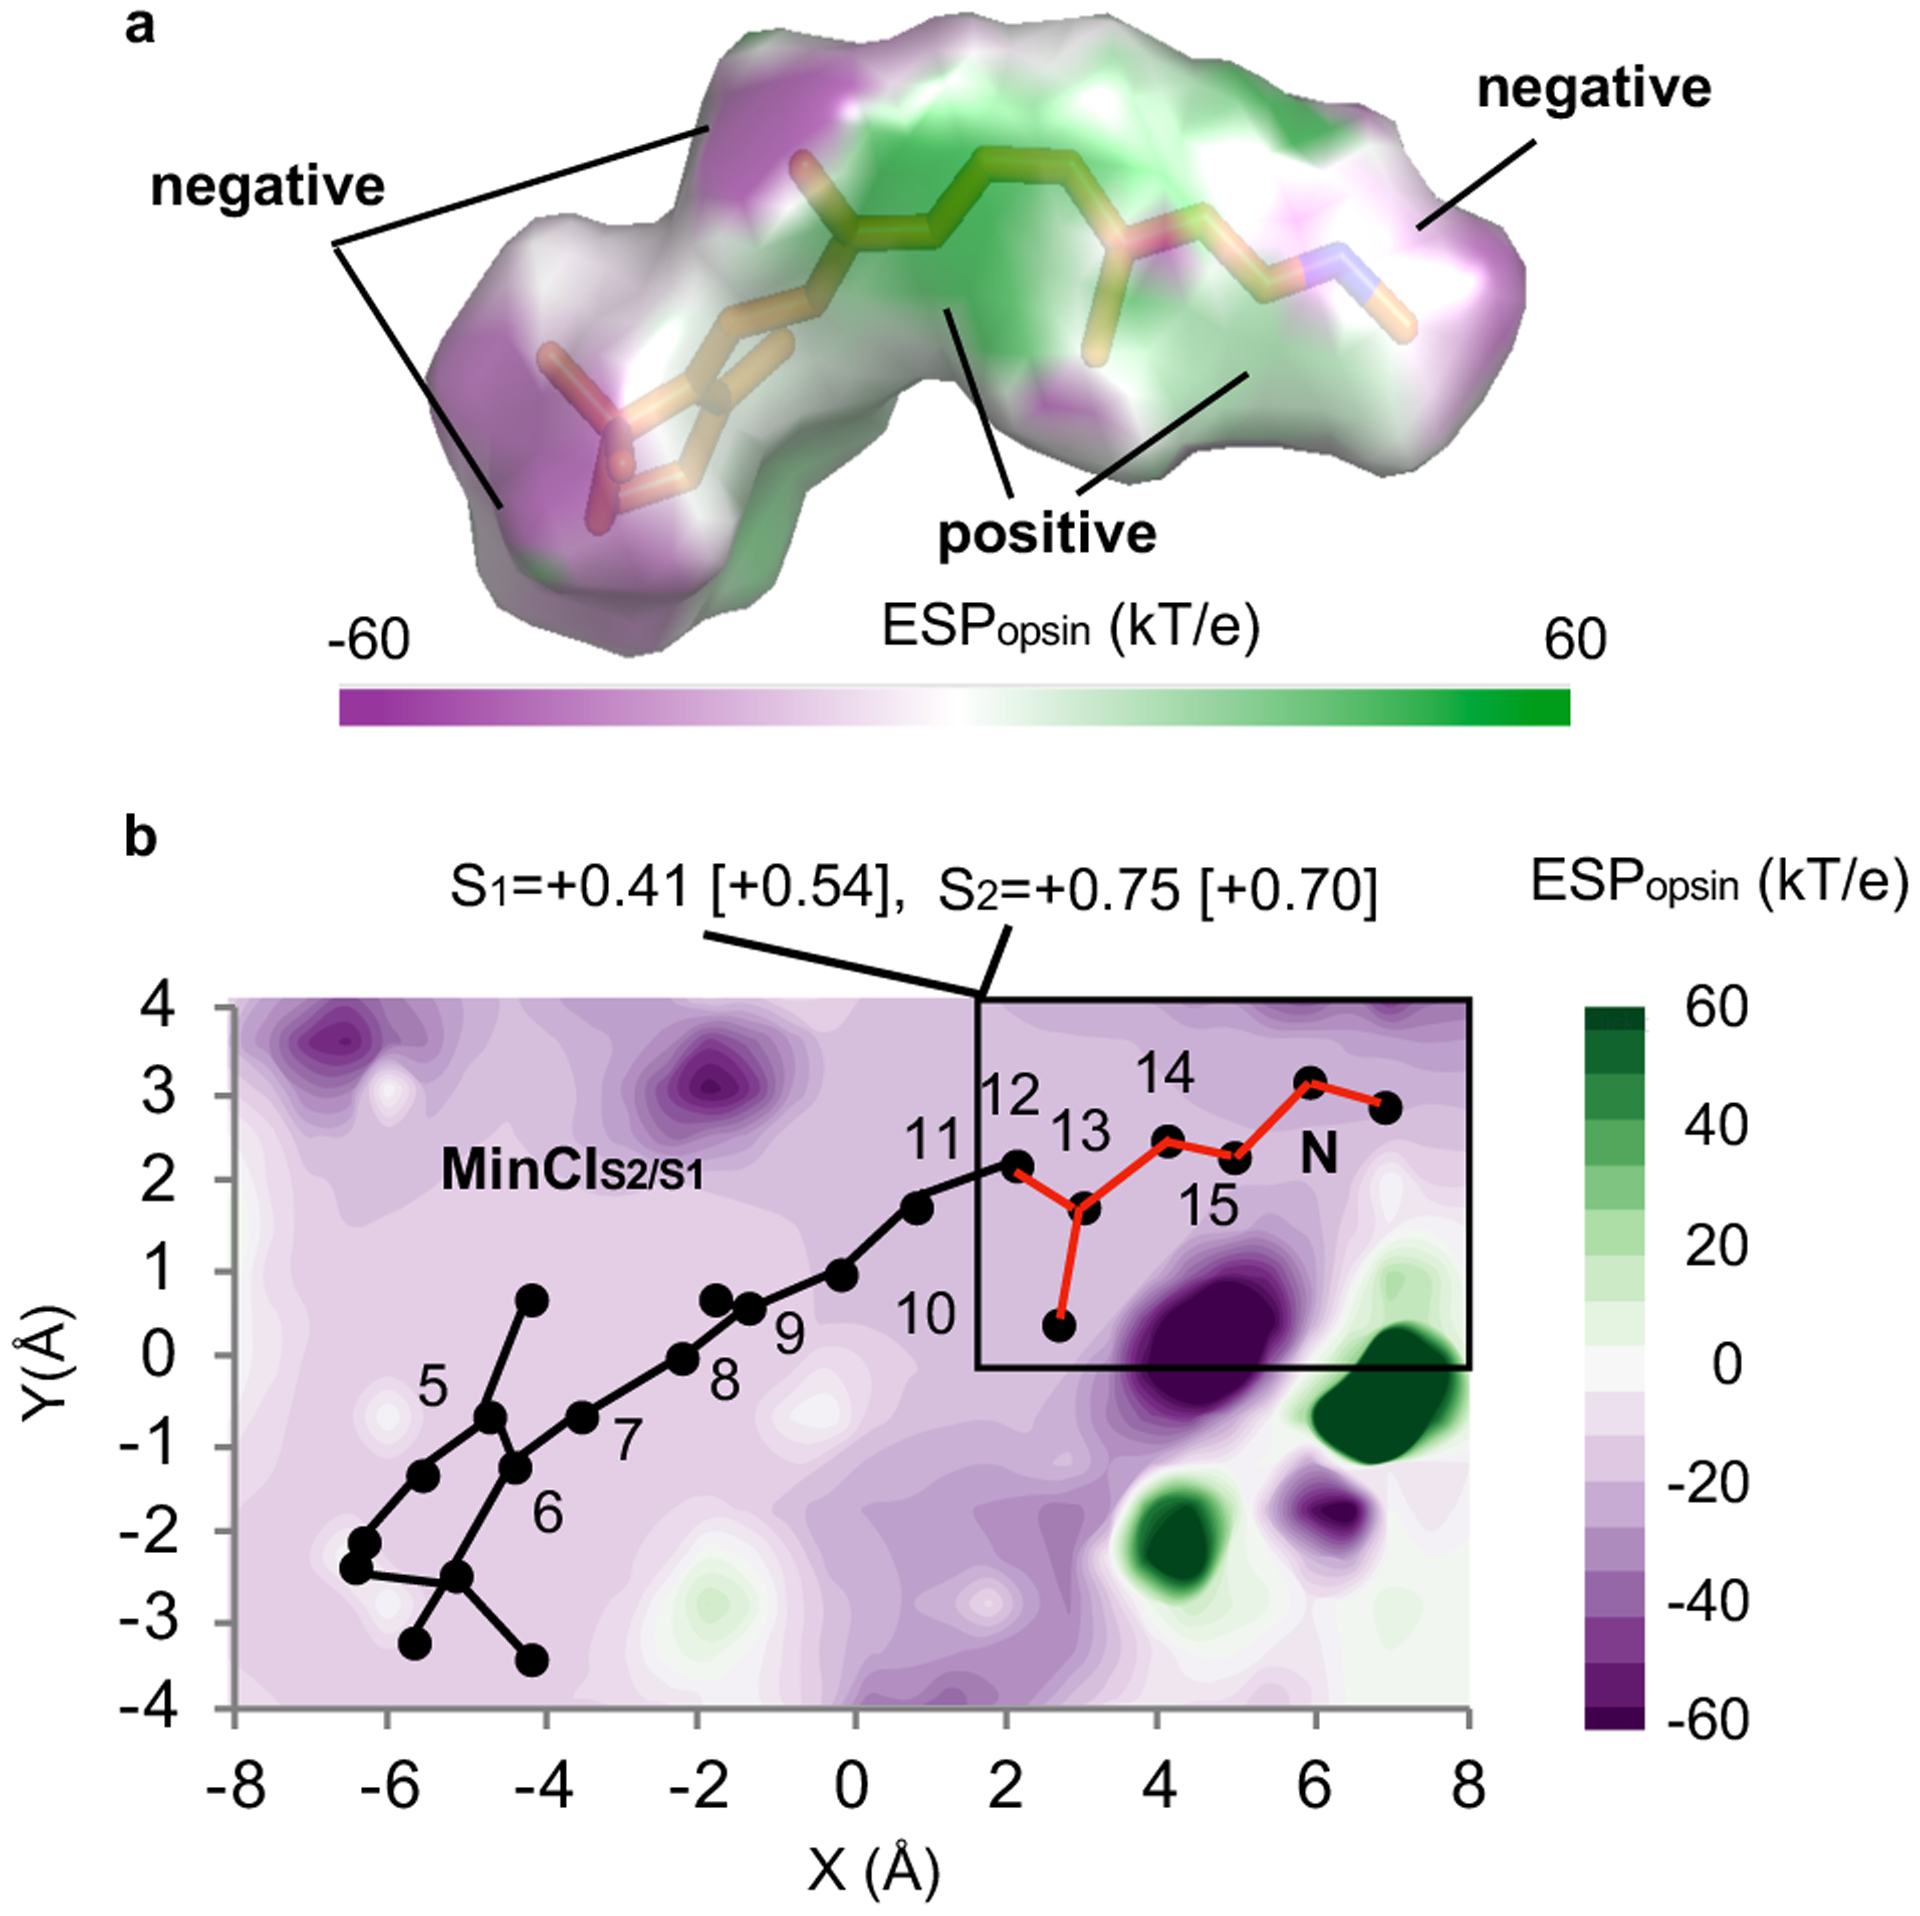
Fig. 5. Opsin electrostatic potential at MinCIS2/S1.

(a) Protein electrostatic potential map on the solvent accessible surface (solvent radius 1.4 Å) of the Rh chromophore. (b) Protein electrostatic potential cross-section along the conjugated framework. The fraction of S1 and S2 charges on the chromophore Schiff base region (framed moiety in red) are given at the top of the panel. The corresponding FC charges are given in square brackets.
