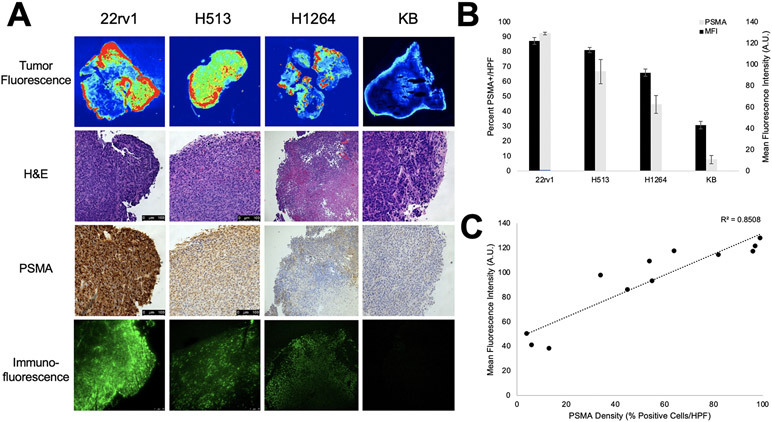
Figure 5.
Correlative ex vivo histopathology of flank xenografts and association of fluorescence with density of PSMA expression. All mice were administered 2 mg/kg OTL78 and mice were sacrificed 4 hours after OTL78 administration. A. Representative images from 22rv1, H513, H1264, and KB xenografts showing macroscopic tumor fluorescence, hematoxylin and eosin staining, immunohistochemical staining for PSMA, and immunofluorescence by fluorescence microscopy. B. Mean tumor MFI for each xenograft group plotted adjacently to PSMA density (% PSMA-positive cells/HPF) with error bars for the respective groups. C. Scatter plot of mean fluorescence intensity vs. PSMA density showing strong correlation between the two (R2=0.8508). Each point represents a single tumor.

