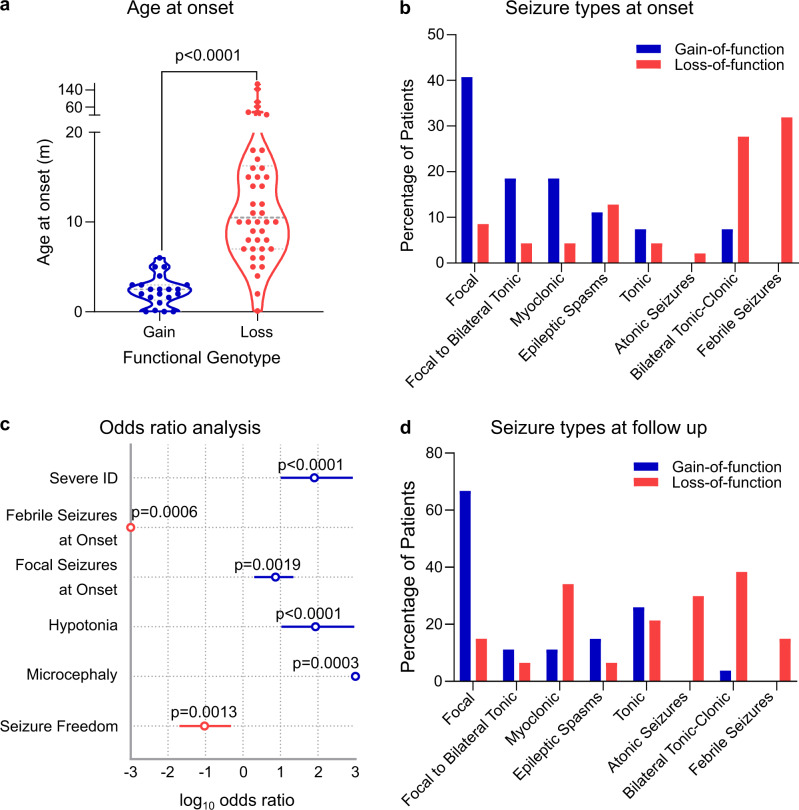
Fig. 4. Clinical features of patients harbouring a LOF or GOF GABRB3 variant.
a Violin plot of age of seizure onset at gain-of-function (blue; n = 21 patients) and loss-of-function (red; n = 43 patients) variants. Dots represent individual data points, dotted lines represent median and quartiles. Two-sided unpaired Mann–Whitney U test, p = 1.1 × 10⁻¹¹, U = 39). b Selected seizure types reported at onset for patients with gain-of-function (blue bars) and loss-of-function (red bars) variants. Percentage of patients reporting each seizure type is shown. c Odds ratio of key clinical outcomes in gain-of-function vs. loss-of-function variants with the centre circle showing the log10 odds ratio and 95 % confidence interval. Blue indicates significant enrichment in gain-of-function variants, and red indicates significant enrichment in the loss-of-function variants. For each indication, the total number of patients reporting were n = 18, 27, 27, 16, 11 and 19 gain-of-function patients, and n = 40, 47, 47, 27, 24 and 36 loss-of-function patients for severe intellectual disability, febrile seizures, focal seizures, hypotonia, microcephaly and seizure freedom, respectively. Fisher’s exact test, two-sided, p = 2.7 × 10⁻⁸, 2 × 10⁻⁵, 0.019, 3.5 × 10⁻⁷, 3 × 10⁻⁴ and 0.013, respectively. d Selected seizure types reported at follow-up for patients with a gain-of-function (blue bars) and loss-of-function (red bars) variants. Percentage of patients reporting each seizure type is shown. Source data are provided in the supplementary information (Supplementary Table S1).

