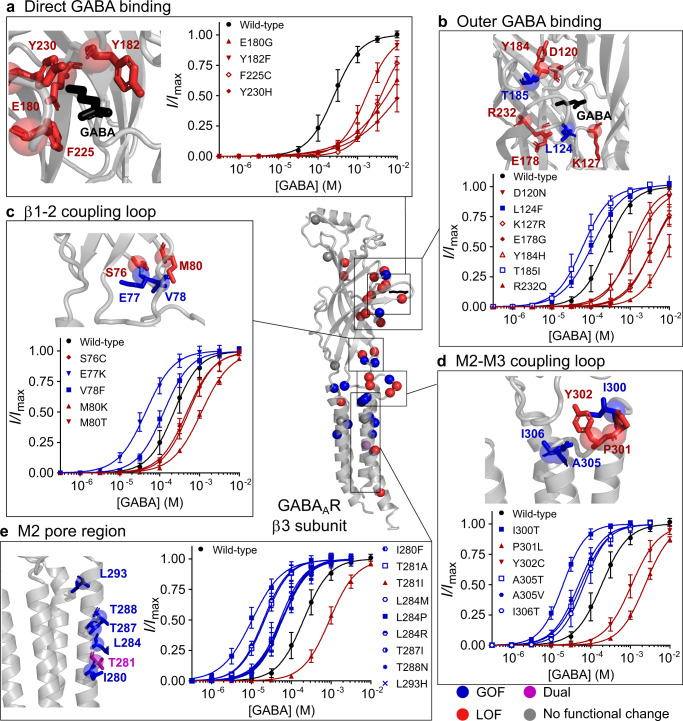
Fig. 7. 3D structural map and concentration–response curves.
3D structure of GABAA receptor β3 subunit displaying the location of: gain-of-function (blue), loss-of-function (red) and dual (purple) variants, with the variants showing no functional change in grey. a–e Structure of the β3 subunit with the backbone coloured in grey and a close-up view of residues a directly binding GABA; b in the outer shell of GABA binding; c β1-2 coupling loop; d M2-M3 coupling loop and e M2 region with amino acid sidechains of residues containing variants in sticks. Red indicates loss-of-function, blue indicates gain-of-function variants and GABA is in black. Concentration–response curves for variants directly binding GABA. Dots represent mean ± s.d. and lines the fitted Hill equation. Wild-type concentration–response curves run on the same days as the variants are shown in black. Red indicates loss-of-function and blue indicates gain. For each panel, a n = 35, 12, 11, 12, 12 independent experiments at wild-type, E180G, Y182F, F225C, Y230H; b n = 34, 11, 12, 14, 13, 11, 13, 14 at wild-type, D120N, L124F, K127R, E178G, Y184H, T185I, R232Q; c n = 34, 12, 11, 12, 11, 10 at wild-type, S76C, E77K, V78F, M80K, M80T; d n = 36, 15, 11, 12, 10, 10, 24 at wild-type, I300T, P301L, Y302C, A305T, A305V, I306T; e n = 57, 12, 14, 11, 11, 12, 12, 11, 11, 11 at wild-type, I280F, T281A, T281I, L284M, L284P, L284R, T287I, T288N, L293H. Source data are provided in the Source Data file.

