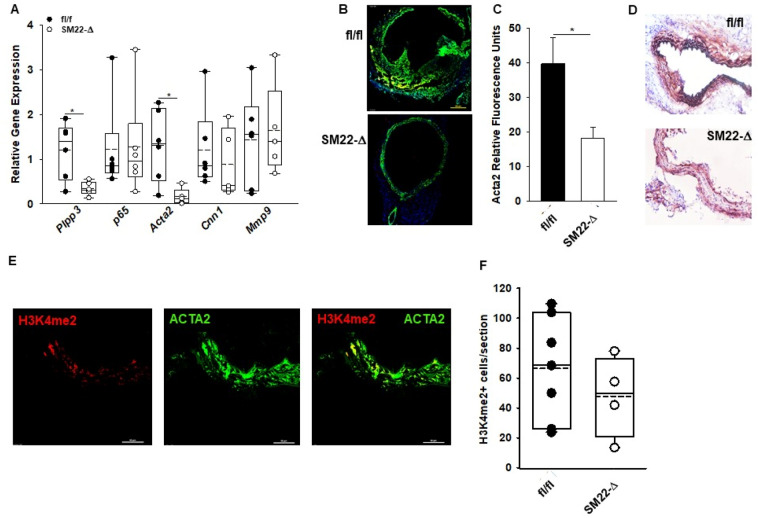
Figure 4.
Smooth muscle cell phenotypic switching in SM22-Δ mice. (A) Abdominal aorta gene expression from fl/fl (n = 5) and Sm22-Δ (n = 5) mice following 4 week AngII treatment. Data is represented as relative gene expression. Relative gene expression was calculated using an average CT value from fl/fl mice treated with AngII for 4 weeks. fl/fl mice treated with AngII for 4 weeks were used as the control and compared to SM22-Δ mice treated with AngII for 4 weeks. *P < 0.05, unpaired two- tailed student t-test. (B) Immunofluorescence of Acta2 (green) and DAPI (blue) in abdominal aorta from fl/fl and SM22-Δ mice following 28 day AngII treatment. (C) Relative Acta2 fluorescence in abdominal aorta from fl/fl (n = 7) and SM22-Δ (n = 4) mice treated with AngII. Acta2 staining was quantified with Image J and presented as mean ± SEM. *P < 0.05, Welch’s t-test. (D) Representative calponin stained images of abdominal aorta from fl/fl and SM22-Δ mice following 4 weeks AngII treatment. (E) Immunofluorescence of H3K4me2 (red) on Myh11 promoter and Acta2 (green) in abdominal aorta from fl/fl mice following 28 day AngII treatment. Representative image is shown. (F) Number of H3K4me2+ cells per section from fl/fl (n = 7) and SM22-Δ (n = 4) mice following AngII treatment.

