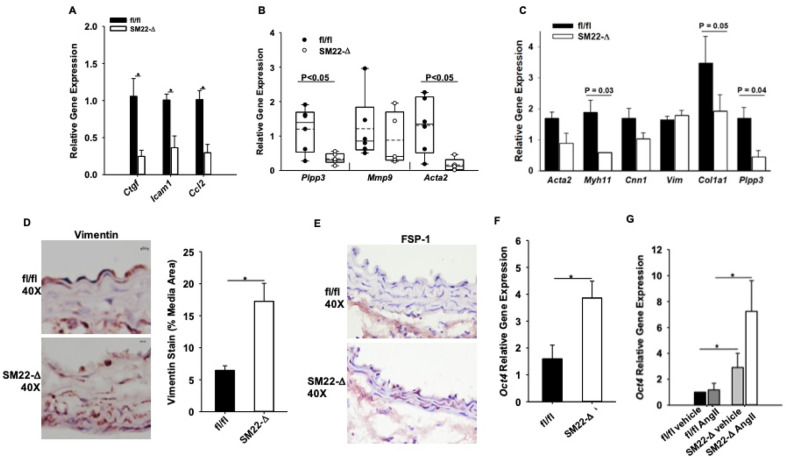
Figure 5.
Reduced inflammation in SM22-Δ abdominal aorta. (A) Gene microarray were performed in abdominal aorta following 1 week AngII infusion in fl/fl (n = 3) and SM22-Δ (n = 3) mice, *P < 0.05, unpaired two-tailed student t-test. Relative gene expression was calculated using an average CT value from fl/fl mice treated with AngII for 1 week. fl/fl mice treated with AngII for 1 week were used as the control and compared to SM22-Δ mice treated with AngII for 1 week. (B) Abdominal aorta gene expression from fl/fl (n = 4) and SM22-Δ (n = 3) mice following AngII treatment. Data is represented as relative gene expression, *P < 0.05, unpaired two-tailed student t-test. Relative gene expression was calculated using an average CT value from fl/fl mice treated with AngII for 1 week. fl/fl mice treated with AngII for 1 week were used as the control and compared to SM22-Δ mice treated with AngII for 1 week. (C) Gene expression of isolated aortic SMC from fl/fl (n = 3) and SM22-Δ (n = 3) following 24 h AngII treatment. Relative gene expression was calculated using an average CT value from fl/fl mice treated with AngII for 1 week. fl/fl mice treated with AngII for 1 week were used as the control and compared to SM22-Δ mice treated with AngII for 1 week. (D) Representative vimentin stained abdominal aorta from fl/fl andSM22-Δ mice following 1 week AngII infusion and percent area of vimentin stain in abdominal aortas from fl/fl (n = 4) and SM22-Δ (n = 3). Vimentin stain was quantified with Image J and presented as mean ± SEM. *P < 0.05, unpaired two-tailed student t-test. (E) Representative FSP-1 stained abdominal aorta from fl/fl and SM-Δ mice following 1 week AngII infusion. (F) Abdominal aorta Oct4 gene expression from fl/fl (n = 4) and SM22-Δ mice (n = 4) *P < 0.05, unpaired two-tailed student t-test. Relative gene expression was calculated using an average CT value from fl/fl untreated SMCs. fl/fl untreated SMCs were used as the control and compared to untreated SM22-Δ SMCs. (G) Oct4 gene expression of isolated aortic SMC from fl/fl (n = 3) and SM22-Δ (n = 3) following 24 h AngII treatment, *P < 0.05, Two way ANOVA, Holm-Sidak, all pairwise multiple comparison. Relative gene expression was calculated using an average CT value from fl/fl 24 h AngII treated SMCs. fl/fl 24 h AngII treated SMCs were used as the control and compared to 24 h AngII SM22-Δ SMCs.

