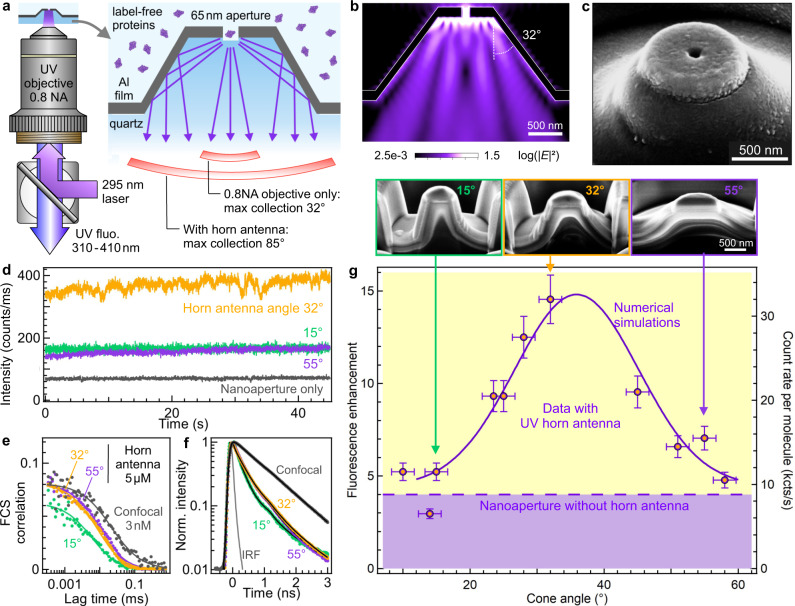
Fig. 1. Ultraviolet horn antenna to enhance the autofluorescence detection of single label-free proteins.
a Scheme of the experiment. b Numerical simulation of the emission pattern of a dipole located in the center of the nanoaperture, averaging the contributions from horizontal and vertical dipole orientations. c Scanning electron microscope image of a horn antenna. Similar images could be reproduced more than 10 times using the same milling parameters. d Fluorescence intensity time traces recorded on a 5 µM solution of p-terphenyl using horn antennas of different cone angles. e FCS correlation functions corresponding to the traces shown in (d), the case for the isolated nanoaperture is equivalent to the horn antennas with cone angles 32 and 55°. f Normalized fluorescence lifetime decay traces acquired simultaneously to the data in (d, e). IRF indicates the instrument response function. Black lines are numerical fits. g Fluorescence enhancement of the brightness per molecule as a function of the horn antenna cone angle. The right axis shows the corresponding count rate per p-terphenyl molecule at 80 µW of the 266 nm laser. The level achieved with a nanoaperture without any horn antenna is indicated by the dashed horizontal line. The solid line shows the numerical simulations results accounting for the collection efficiency gain into the 0.8 NA microscope objective. The SEM images in the inset show the antenna geometry after a cross-section has been cut by focused ion beam. Data are presented as mean values +/− one standard deviation determined from a pool of at least three different samples.

