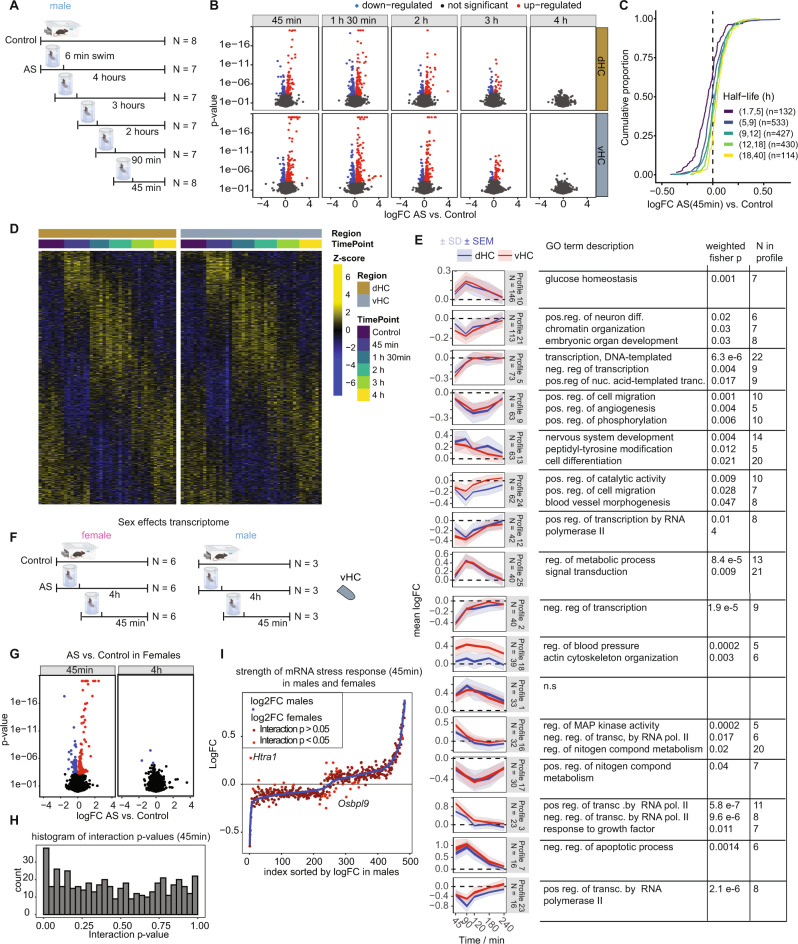
Fig. 2. The effects of acute swim (AS) stress on the transcriptome of dorsal hippocampus (dHC) and ventral hippocampus (vHC) across time.
A Experimental design (experiment in male mice). B Volcano plots showing the log fold change and statistical results of RNA transcripts at 5 different time points after exposure to AS. Red and blue values represent changes within 5% FDR. (N = 7–8 per group). Ceiling for p values was set to 1E-20. C Cumulative fold change distributions of genes with different half-lives, consistent with the downregulation being the result of normal mRNA decay. D Heatmaps showing expression of all differentially-expressed genes in all samples. E K-means clustering of differentially expressed RNA transcripts to resolve temporal profiles, and their GO term description. K-means clustering was done with 25 centers, of which the ones with fewer than 15 transcripts were excluded. Clusters are ordered by decreasing number of genes. Blue indicates expression in the dHC, red in the vHC. Plots indicate both standard error of the mean (SEM) of logFC in bright color and standard deviation (SD) in faint color. n.s no significant enrichment. F Experimental design of tests for transcriptomic sex differences. G Volcano plots depicting statistical results of stress effects at 45 mins and 4 hours in the vHC transcriptome of females. Red: significant upregulation (FDR adj. p < 0.05), blue: significant down-regulation (FDR adj. p < 0.05) (H) Histogram of interaction p values of all stress or sex responsive mRNAs. I AS vs ctrl logFCs in males (blue) and females (red) sorted by stress response strength in males. mRNAs with significant AS: Sex interaction are labeled in bright red.

