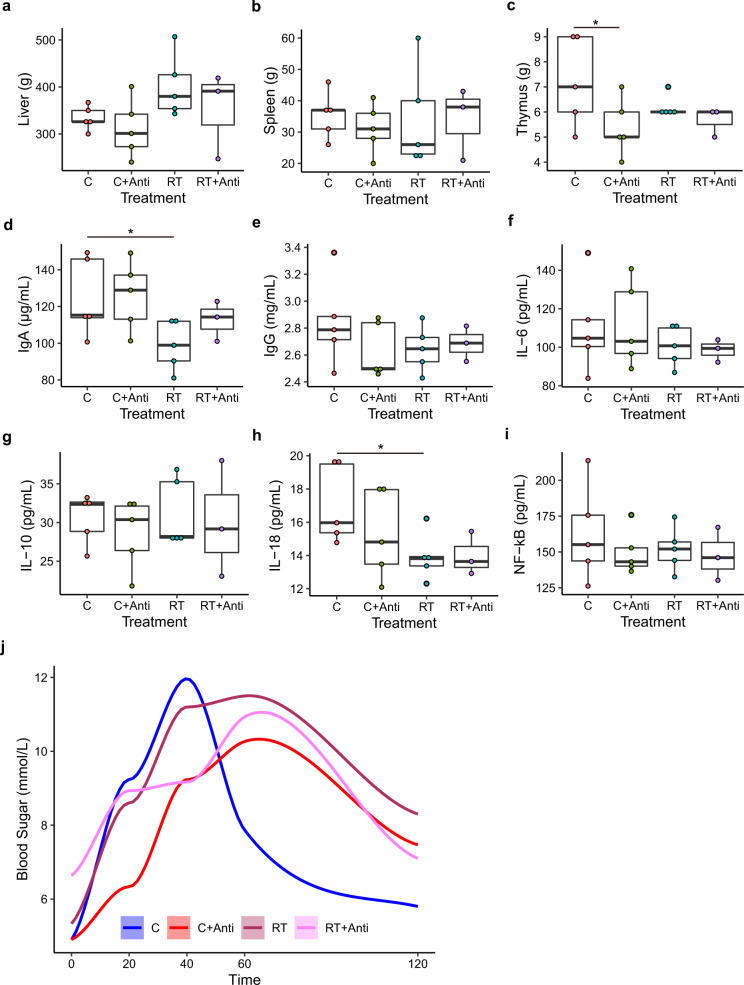
Fig. 2. Effects of cold stress on the weight of organs, immune factors, and cytokines in serum and glucose tolerance tests.
a Liver weight. b Spleen weight. c Thymus weight. d IgA level in serum. e IgG level in serum. f IL-6 level in serum. g IL-10 level in serum. h IL-18 level in serum. i NF−kB level in serum. j Glucose tolerance test. The data are the means ± SEMs (n = 3 or 5 per group). Statistical significance was determined using Wilcoxon test (*p < 0.05, **p < 0.01, ***p < 0.001).

