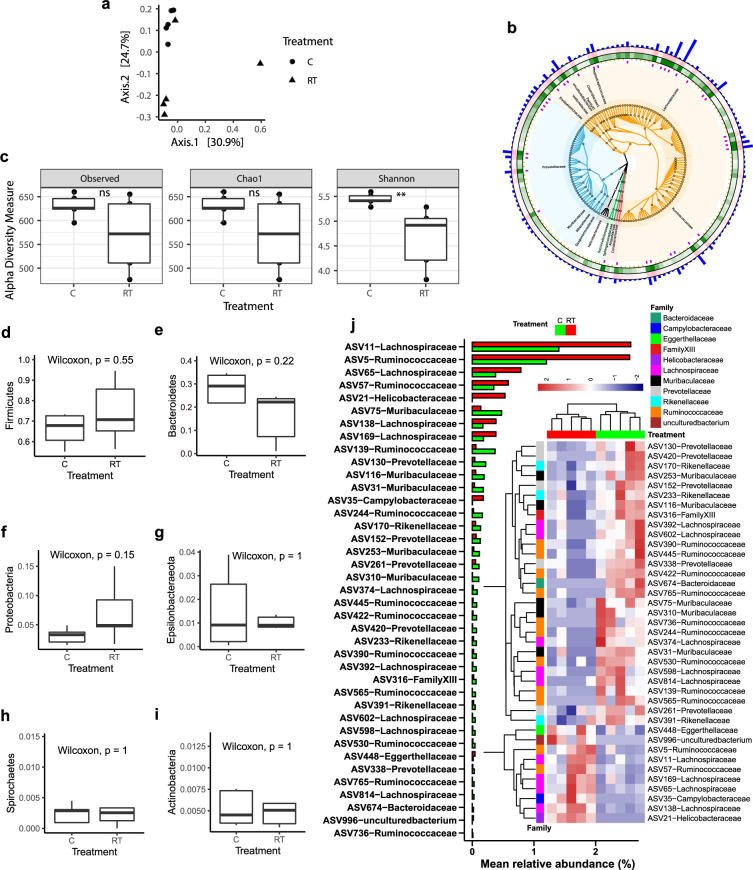
Fig. 3. Cold exposure changes the cecal microbiota composition.
a Principal coordinates analysis (PCoA) based on the weighted UniFrac distances. Each symbol represents a single sample of the cecal content after 48 h of cold exposure (n = 5) or RT controls (n = 5 per group). b Heatmap tree comparing the most abundant ASVs from the cecum content of 48 h cold-exposed animals (n = 5, inner green rings) and RT controls (n = 5, outer pink rings) and their phylogenetic relationships. The bar represents abundant ASVs. Firmicutes and Bacteroidetes appear in orange and blue colors, respectively. c The alpha diversity of ASVs. d–i Boxplot of the microbiota of the cecal contents at the phylum level. j The different ASVs with a bar and heatmap with P < 0.05. The data are the means ± SEMs (n = 5 per group).

