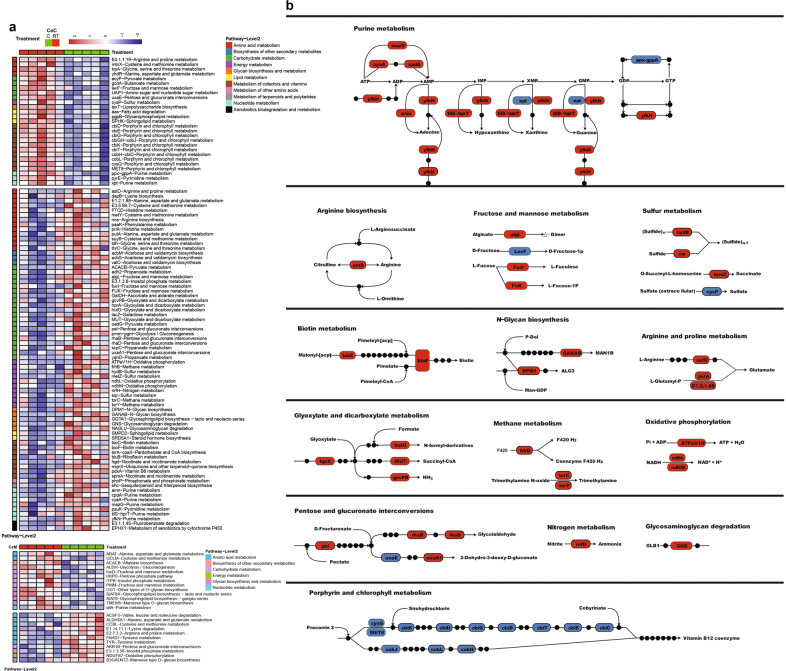
Fig. 4. Cold exposure changes the function of microbiota genes involved in metabolism in the cecum, as indicated by the KO genes and KEGG pathway modules.
a Heatmap differences at the metabolic level of the microbiota of the contents and epithelial surface of the cecum. b Representative pathway with the highest difference in abundance. Red indicates higher expression of genes, and blue indicates lower expression of genes, in piglets under cold stress compared with RT. CeC and CeM represent the cecal content and the cecal epithelial surface respectively. The data are the means ± SEMs (n = 5 per group).

