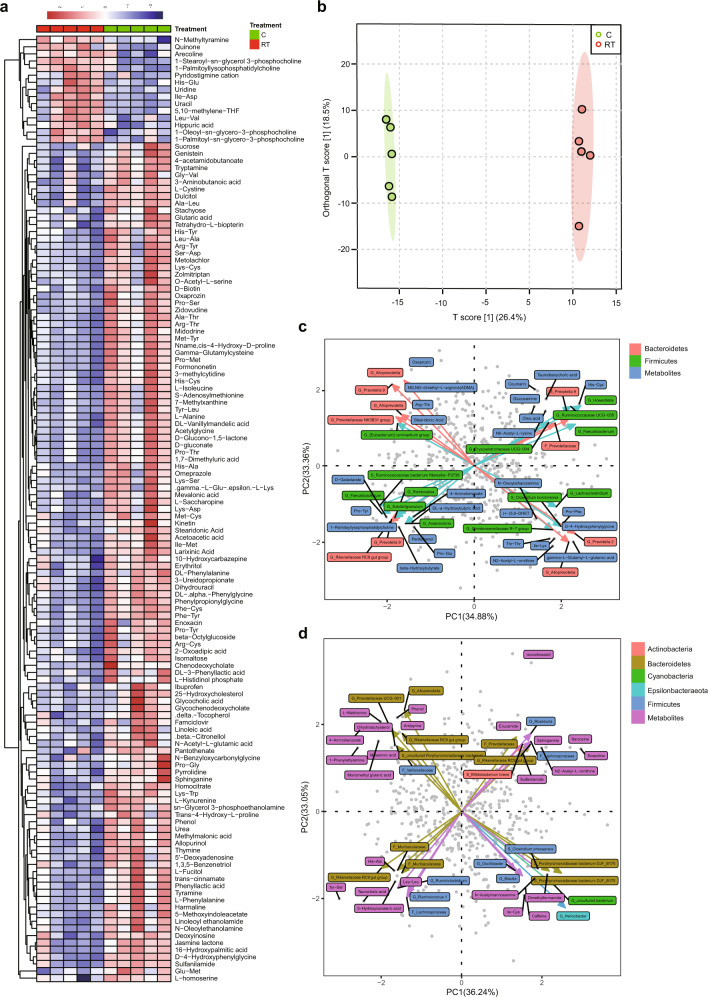
Fig. 5. Different metabolomic alterations in serum in the positive model and strong correlation with the microbiota of the contents and epithelial surface of the cecum.
a Heatmap of differences in serum metabolites under cold stress. b Partial least-squares discriminant analysis (PLS-DA) of metabolites in serum. c Correlation of metabolite in serum with the microbiome of the cecal content. d Correlation of metabolites with the microbiota of the epithelial surface of the cecum. The data are the means ± SEMs (n = 5 per group).

