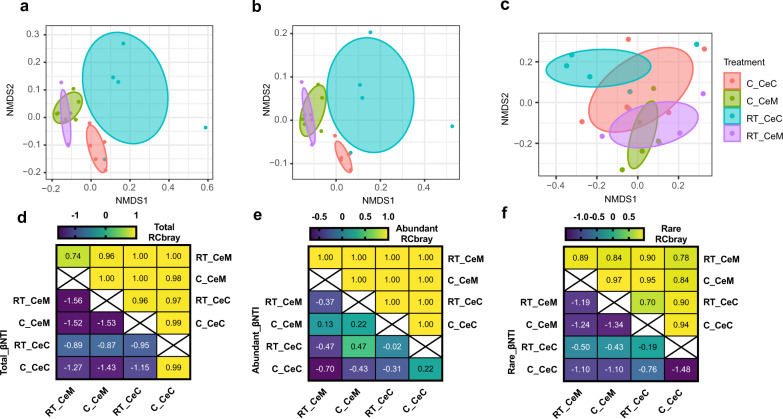
Fig. 7. Taxonomic distribution of total, abundant, and rare ASVs in the different groups.
ASVs with average relative abundances ≥1% and <0.1% were assigned as abundant ASVs and rare ASVs, respectively. Nonmetric multidimensional scaling (NMDS) plots of beta-diversity were generated from a total ASVs. b Abundant ASVs. c Rare ASVs. Heatmap of beta nearest taxon index (βNTI) and the Raup–Crick metric based on the relative abundances of the ASVs (RCBray) of total, abundant, and rare communities are shown in (d–f), respectively. RT_CeM and C_CeM represent the cecal epithelial surface in the RT group and cold-stressed groups, respectively, while RT_CeC and C_CeC represent the cecal content in the RT and cold-stressed groups, respectively.

