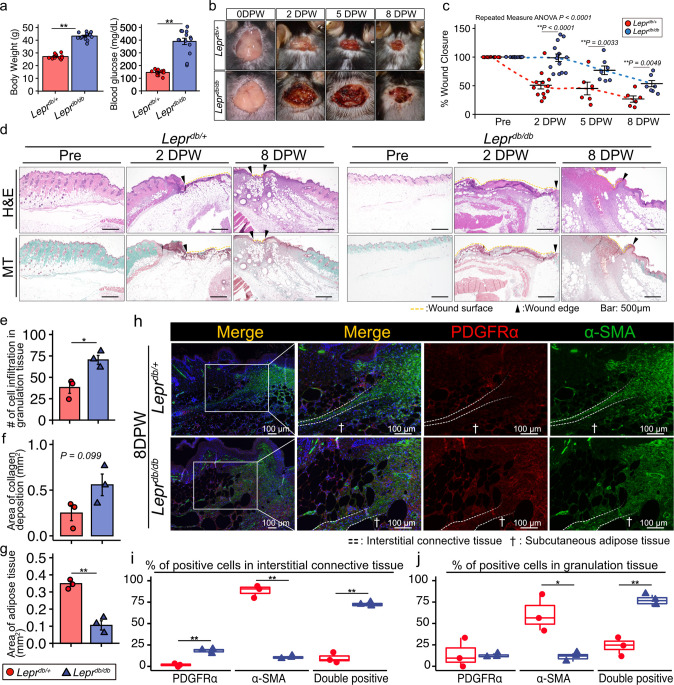
Fig. 1. Leprdb/db mice exhibit impaired wound healing.
a Body weight and blood glucose levels for Leprdb/+ and Lperdb/db mice before full-thickness excisional skin wounds were created (n = 12 for Leprdb/+ and n = 14 for Lperdb/db mice). b Representative wound images during the healing process and (c) the wound area, reported as the percent of wound closure compared to the 0 days post wound (0 DPW) area (n = 12 for Leprdb/+ 0 and 2 DPW, n = 6 for Leprdb/+ 5 and 8 DPW, n = 14 for Lperdb/db 0 and 2 DPW, and n = 7 for Leprdb/db 5 and 8 DPW). d Representative images of H&E staining and Masson trichrome (MT) staining of a wound at pre-wounding, 2 DPW, and 8 DPW. e Quantitative data concerning the number of infiltrated cells. f Area covered by collagen deposits. g Area covered by adipose tissue (n = 3 for each group). h–j Representative images of a wound at 8 DPW following immunostaining for PDGFRα and α-SMA (h), and percentage of cells positive for either PDGFRα, α-SMA, or both in interstitial connective tissue (i) and in granulation tissue (j) (n = 3 for each group). Quantitative data are shown as means ± SE in dot plots or box-and-whisker plots with IQRs and 1.5 times the IQR. p-values were determined using either a two-tailed Student’s t-test or the Tukey method for one-way ANOVA (*p < 0.05 and **p < 0.001).

