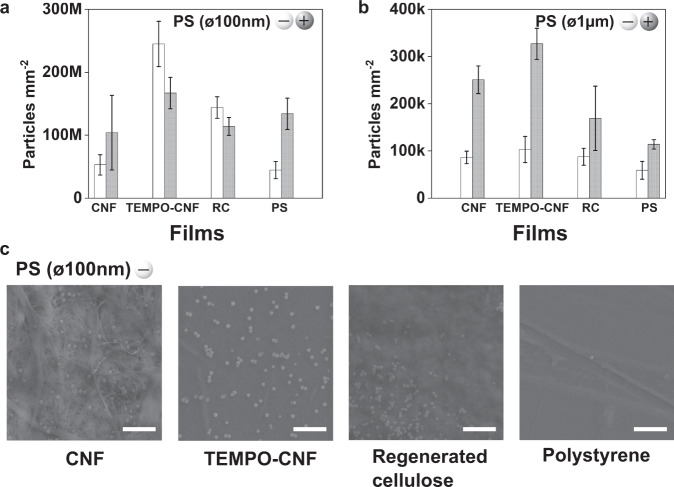
Fig. 2. Quantitative assessment of entrapped fluorescent nano- and microplastic particles of different size and charge by self-standing films.
a Number of captured nanoplastic polystyrene (PS) particles PS(ø100 nm) and (b), microplastic particles PS(ø1µm) calculated based on the fluorescence detection. White bars represent negatively charged plastic particles, and gray bars positively charged plastic particles. The full data for all captured particles are presented in Supplementary Table 2. Error bars in (a) and (b) indicate mean ± SD. c SEM images of the films after being contacted with the anionic PS(ø100 nm) dispersion for 10 min. Scale bar in SEM images is 1 µm. Source data are provided as a Source Data file.

