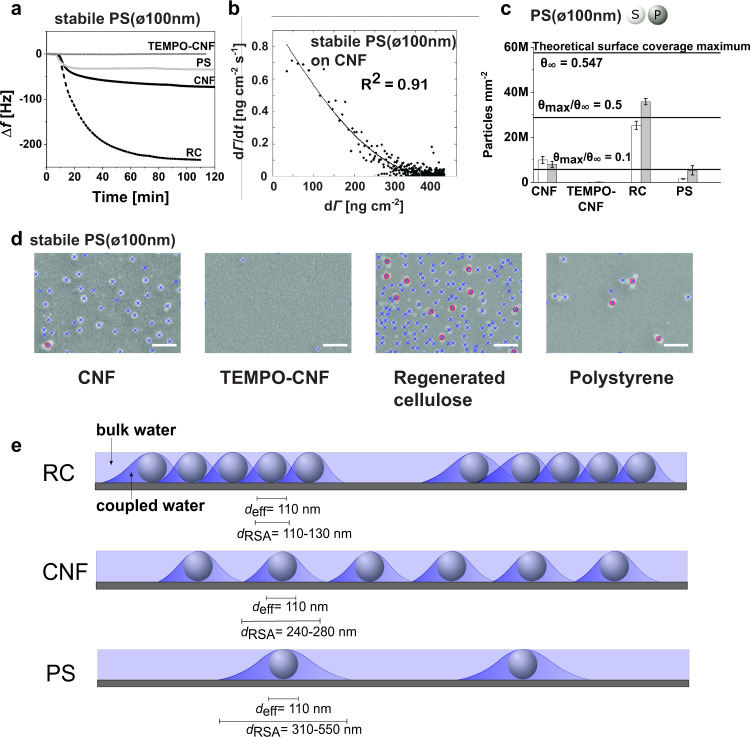
Fig. 3. Quantitative assessment of surface binding of nanoplastic polystyrene (PS) particles (stabile/purified PS(ø100 nm)) using a surface-sensitive approach, quartz crystal microbalance with dissipation monitoring (QCM-D), coupled with image analysis and fittings with random sequential adsorption (RSA) model.
a QCM-D frequency change responses showing the adsorption of stabile PS(ø100 nm) on TEMPO-CNF (dark gray line), PS (gray line), native CNF (solid black line), and RC (dashed black line). b Fitting of the QCM-D adsorption data of stabile PS(100 nm) on CNF using the RSA model. Black dots are measured data, and black line is the RSA fit. The adjusted R2 for the fit is 0.91. c Amount of PS(ø100 nm) detected after the adsorption experiments (white bars stabile, gray bars purified) via image analysis of SEM micrographs contrasted to a theoretical surface coverage maximum (θ∞ = 0.547 which equals to ~5.8 × 10⁻⁷ circles mm−2), which is based on the RSA model. Error bars indicate mean ± SD. d Stabile PS(ø100 nm) recognition from scanning electron microscopy (SEM) images using image analysis (Supplementary Fig 12). Blue crosses indicate single particles and red circles indicate identification of clusters. The SEM image scale bar is 0.5 µm. e Schematic presentations display the appearance of substrates at the end of the PS(ø100 nm) adsorption process showing the existence of bulk water and water which is strongly interacting with the particles. deff describes the effective particle diameter, and dRSA is the diameter of the occupied area (a) of a single particle including the particle and the coupled water. Source data are provided as a Source Data file.

