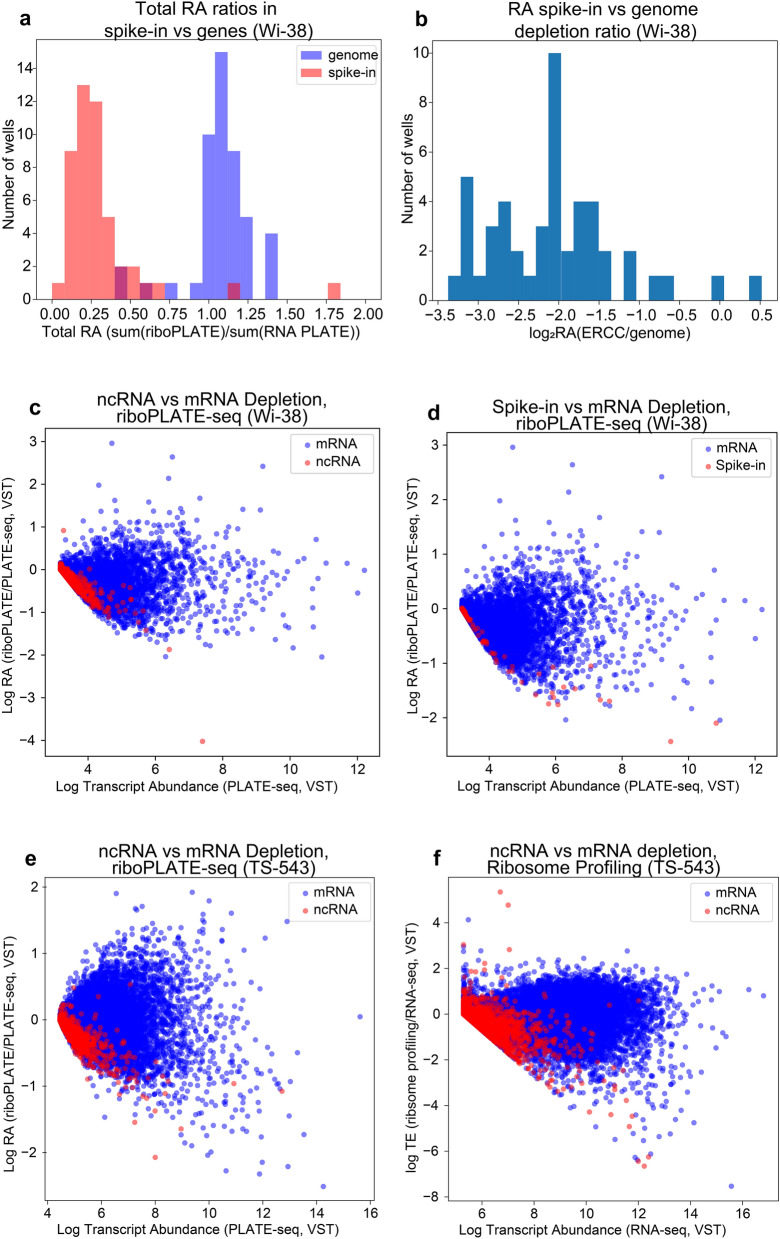
Figure 2.
Assessment of riboPLATE-seq IP specificity. (a) Depletion calculated per-sample as the log2-ratio of the sum of all spike-in or gene-aligned counts in the riboPLATE-seq library over the same sum in the sample’s paired PLATE-seq library, using DESeq2-normalized counts (median of ratios normalization, R v4.0.5), in Wi-38 cells. Spike-ins show more significant depletion than genes in almost all wells (mean spike-in RA 0.25; mean genomic RA 1.04; Wilcoxon signed-rank test p = 1 × 10⁻⁹) (b) The same information in (a), presented as the per-well difference in depletion ratios for ERCC and the background genome, demonstrating significant depletion of spike-in RNA with IP in most libraries (mean log2 depletion ratio − 2.1). (c) Relationship between transcript abundance (in PLATE-seq) and RA (riboPLATE/PLATE-seq) for coding genes and non-coding RNA (ncRNA) in Wi-38 cells. ncRNA are heavily depleted (RA < 0) at all expression levels, to a greater extent than almost all genes. (d) Relationship between transcript abundance and RA for ERCC spike-ins vs coding genes in Wi-38, demonstrating a pronounced pattern of depletion in RA for spike-ins relative to mRNA across all expression levels. (e) Relationship between PLATE-seq transcript abundance and RA for coding genes vs ncRNA in TS-543 cells. (f) The corresponding plot to e derived from ribosome profiling and RNA sequencing data of TE and RNA-seq transcript abundance in TS-543 cells. Though the shape of the distribution is different, ncRNA still demonstrate lower TE than mRNA at higher expression levels.

