Figure 5.
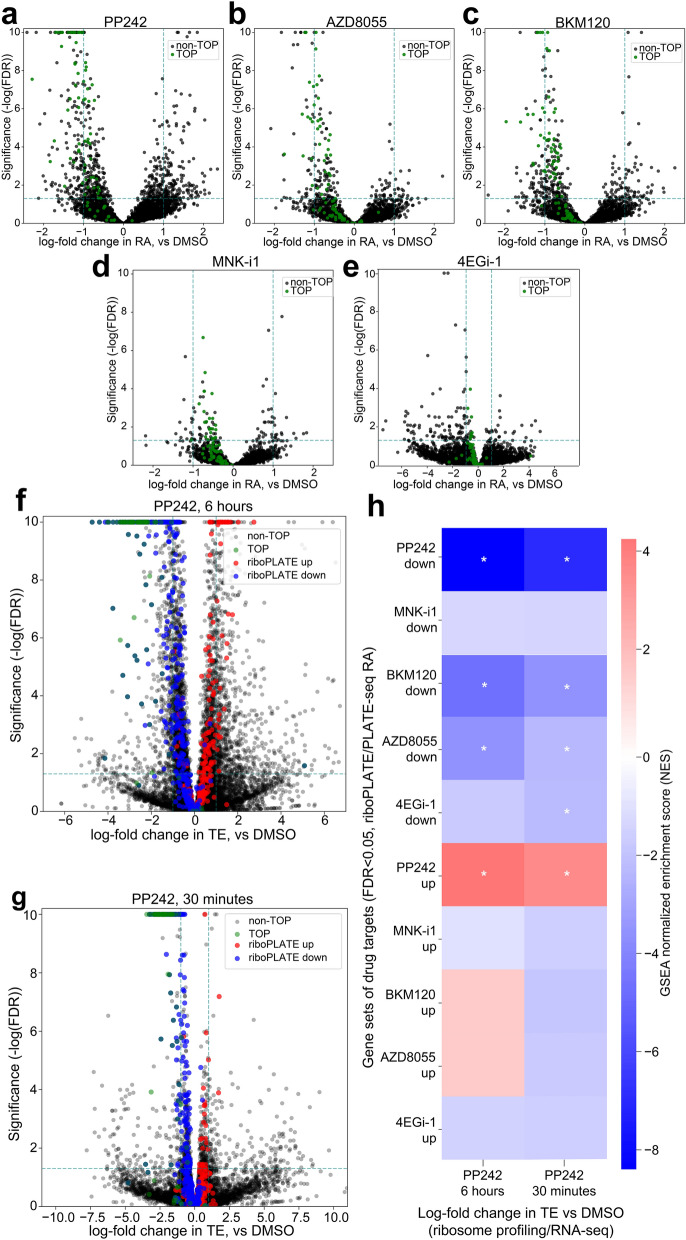
Characterization of Alterations in Ribosome Association (RA) and Comparison with Translation Efficiency (TE) from Ribosome Profiling and RNA Sequencing in TS-543 cells. (a)–(e) Volcano plots of log-fold change in RA per-gene associated with each drug treatment. In each plot, the X axis marks the size and direction of the observed change for each gene, while the Y axis scales inversely with p-value (− log10(p)) to provide a positive metric of significance; TOP motif-containing genes, the canonical targets of mTOR signaling, are colored red. Additionally, dashed lines at y = − log10(0.05) and x = + / − 1.0 provide an estimate of the number and magnitude of significantly up- and down-regulated genes for each condition. Significant TOP gene inhibition is seen in treatment with PP242, AZD8055, and BKM120, but less so with MNK-i1 and not at all with 4EGi-1. (f), (g) Volcano plots of log-fold change in TE per-gene associated with PP242 treatment for 30 min or 6 h, generated from ribosome profiling and RNA sequencing data. Guide lines at y = − log10(0.05) and x = + / − 1 provide gauges of the significance and magnitude of the effects on gene-wise TE at either time point. TOP motif-containing genes, in red, are highly and significantly downregulated in both (Mann–Whitney U test p = 2.9 × 10–46 and p = 1.2 × 10–38 for 6-h and 30-min treatment, respectively). In all volcano plots, genes with p-values less than p = 1 × 10⁻¹⁰ (y = 10) are given a maximum y-value of 10 to prevent skewing of the axes. (h) Enrichment heatmap using GSEA to compare signatures of differential TE (X axis) with sets of genes significantly up- or downregulated (DESeq2 FDR < 0.05) at the level of RA by different 6-h drug treatments determined with riboPLATE-seq. Gene sets found significantly enriched or depleted in lfcTE (GSEA Bonferroni-adjusted FWER < 0.05) are marked with asterisks (*). Genes affected by PP242, BKM120, and AZD8055 are concordantly altered in TE after 6 h of PP242 treatment, while only the genes impacted by PP242 at the level of RA are similarly affected in TE after 30 min of PP242 treatment, with all other gene sets demonstrating varying degrees of downregulation (GSEA Normalized Enrichment Score < 0).

