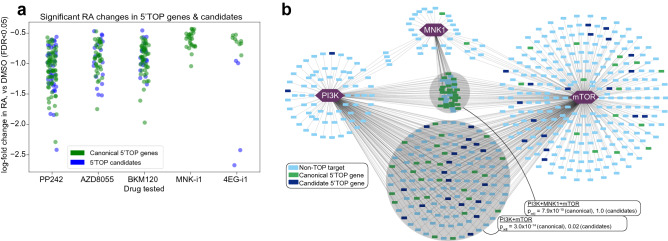
Figure 7.
Distribution of TOP Motif-Containing Genes and Candidates in a Modeled Translational Control Network in TS-543 cells. (a) TOP genes and candidates significantly perturbed in RA by drug treatments. Strip plots along the X axis, labeled for each drug treatment in our riboPLATE-seq study, contain log-fold changes in RA (Y axis) for the genes exhibiting significant RA perturbations (FDR < 0.05) under each treatment relative to DMSO controls, excluding non-TOP-containing genes. TOP candidates behave similarly to canonical TOP genes, exhibiting decreased RA under treatment with mTOR axis inhibitors (PP242, AZD8055, BKM120) while MNK-i1 and 4EGi-1 elicit fewer significant alterations in these sets. (b) Network representation of targets of mTOR, PI3K, and MNK1, interpreted as the genes exhibiting significant decreases in RA under treatment with PP242, BKM120, and MNK-i1, respectively (FDR < 0.05). Targets are color-coded for identification as canonical 5’TOP motif-containing genes (green), TOP gene candidates with known mouse homologues (navy blue) and other genes (light blue). Shaded circles denote subsets of the network with significant enrichment of canonical and/or candidate TOP genes, with the Fisher’s exact test p-value for either set displayed. P-values are corrected for multiple testing over all gene sets and network intersections tested via Benjamini-Hochberg (false discovery rate/FDR) adjustment. The intersection of all three kinases is enriched for canonical TOP genes, but not candidates (Fisher’s exact test padj = 7.9 × 10⁻¹⁵ and padj = 1.0, respectively), while the intersection of PI3K and mTOR is significantly enriched for canonical TOP genes and less-significantly enriched for candidates (padj = 3.0 × 10⁻¹⁴ and padj = 0.02).

