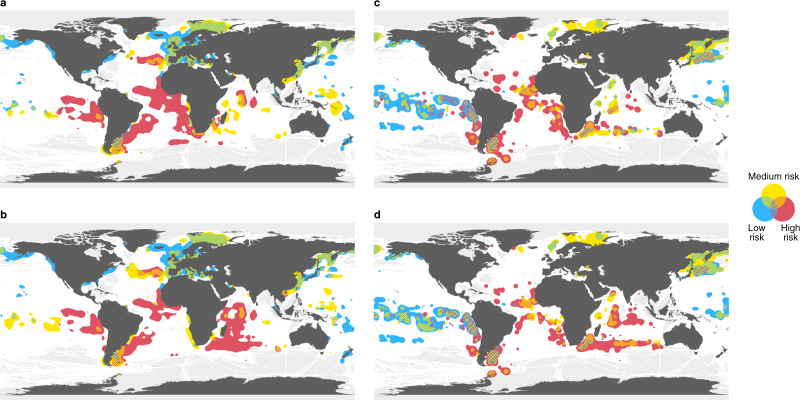
Fig. 2. Risk maps for labor abuse and IUU fishing and associated with transshipment at sea.
At-sea risk areas based on arrival ports for (a) labor abuse and (b) IUU fishing, and transshipment risk areas for (c) labor abuse and (d) IUU fishing. Low-, medium- and high-risk areas are colored in blue, yellow, and red respectively, and overlaps between risk categories are hashed. At-sea areas in white indicate less risk than the colored areas, rather than zero risk. Gray at-sea regions indicate lack of AIS data. For at-sea and transshipment risk areas, each fishing or carrier trip risk score of the arrival port was classified into low-risk (port risk score < 0), medium-risk (0 ≤ port risk score < 2) and high-risk (port risk score ≥ 2), with (a, b) illustrating areas greater than 95% quantile of fishing cumulative hours by all fishing vessels, and (c, d) areas greater than 95% quantile of encounter events between carrier vessels and fishing vessels in 2012–2019 for each risk category. For (a, b), root-mean-square error (RMSE) of cross-validation was 0.88 and Matthews Correlation Coefficient (MCC) was 0.62 for port risk of labor abuse, and RMSE 0.88 and MCC 0.65 for port risk of IUU fishing. For (c, d), RMSE = 1.14 and MCC = 0.49 on port risk of labor abuse, and RMSE = 1.25 and MCC = 0.45 for port risk of IUU fishing.

