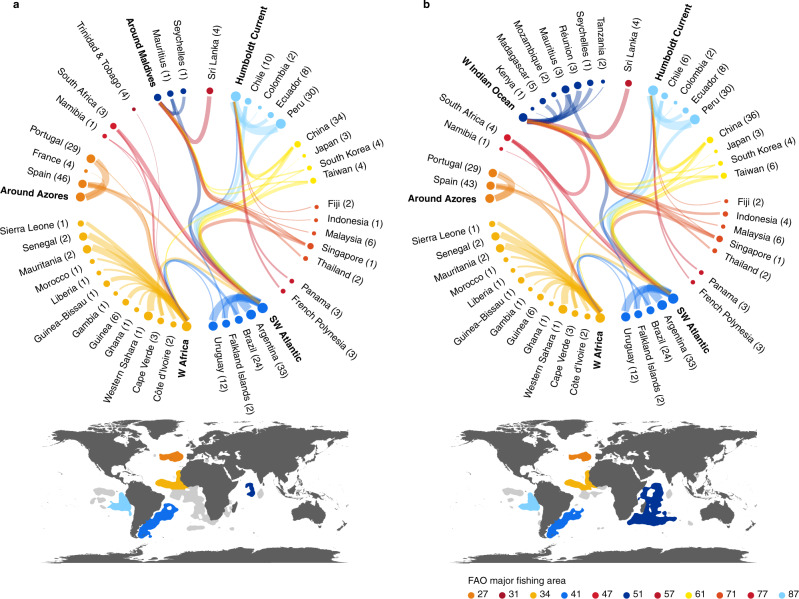
Fig. 4. Spatial linkages between at-sea risk regions and ports.
Interconnections between selected high at-sea risk regions and arrival port countries for (a) labor abuse and (b) IUU fishing. Node size and edge width are proportional to the number of trips from at-sea high-risk regions to destination countries (logarithmic scale). Countries within or bordering the same Food and Agriculture Organization (FAO) Major Fishing Area are grouped by color, and correspond to the geographic extent of the at-risk regions in the associated maps. The full extent of the at-risk regions from Fig. 2 are in gray. Text in bold reflect at-sea risk regions displayed in the maps, which were the focal areas evaluated. Values in parentheses are the number of unique destination ports within each country. For simplicity, each figure captures destination countries with more than 10 trips from each at-sea risk area.

