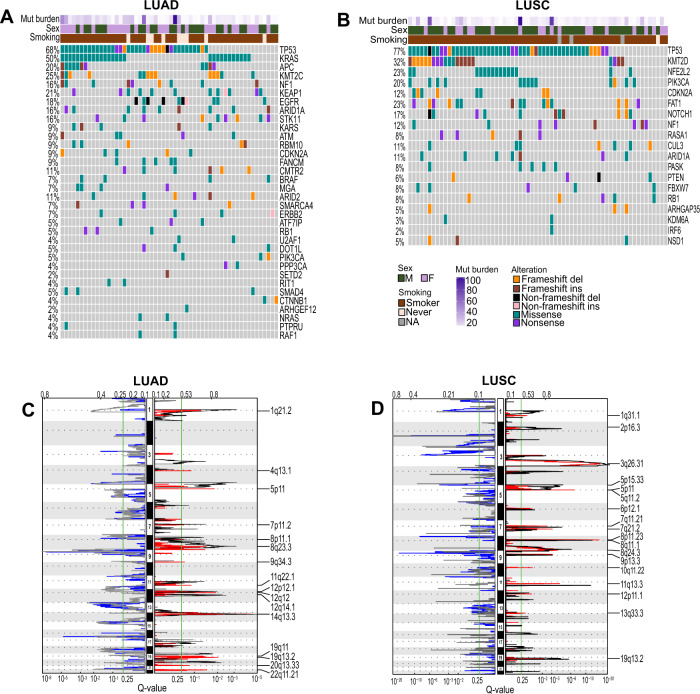
Fig. 3. NSCLC PDX models represent primary tumor genomic features.
A, B Oncoprint showing DNA alterations in frequently altered genes of A LUAD and B LUSC. C, D LUAD (C) and LUSC (D) PDXs GISTIC showing significantly amplified regions in red and significantly deleted regions in blue, TCGA CNV is overlaid for comparison with black showing significantly amplified and gray showing significantly deleted CNV regions in LUAD TCGA patients.

