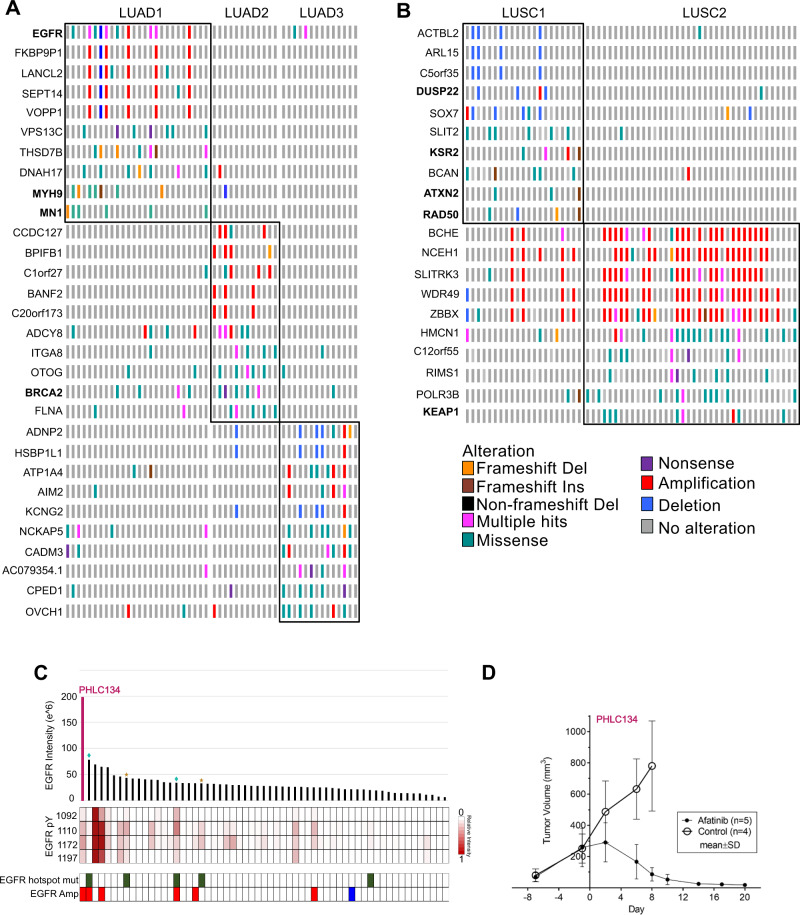
Fig. 7. Proteotypes demonstrate recurrent genomic alterations.
A, B Significantly altered genes associated with A LUAD and B LUSC proteotype are shown. Genes in bold are cancer drivers as defined by cBioportal. C EGFR protein expression, active pY sites, driver mutation and amplification status per LUAD cases. Blue diamonds show responders and yellow star cases show non-responders to EGFR TKI. D Tumor volume growth trend in response to Afatinib (n = 6) vs. Control (n = 5) in NSCLC PDX model 134 that has amplification and elevated protein expression of WT EGFR (mean ± SD) (linear mixed effects model, p-value = 2.3E-15). Source data are provided as a Source Data file.

