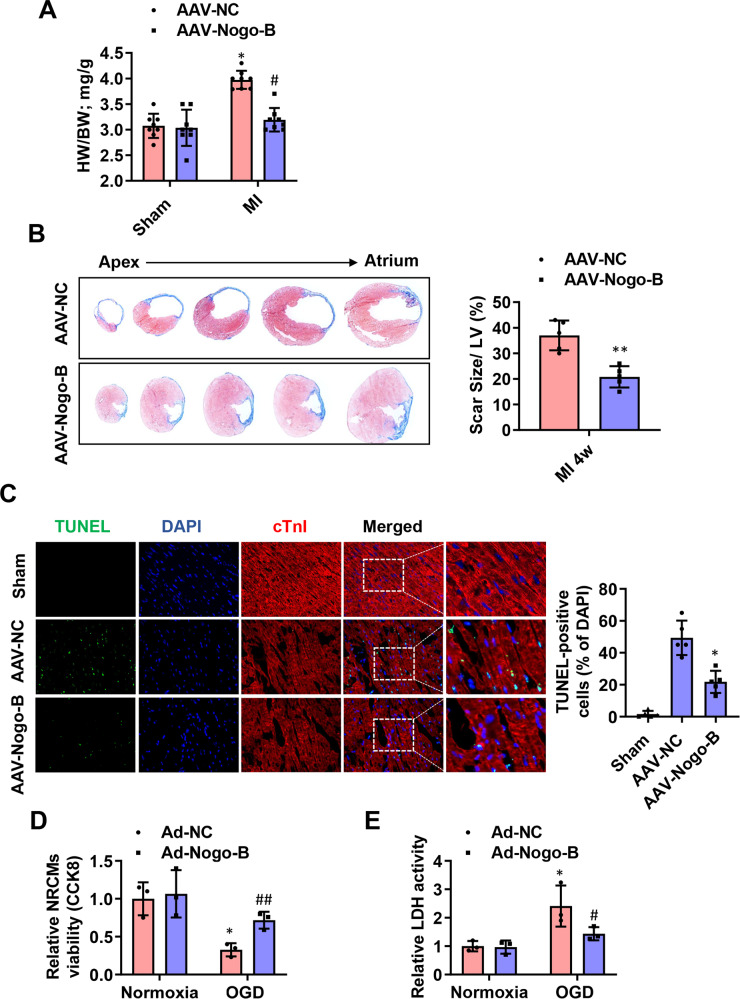
Fig. 3. Nogo-B decreased fibrosis and increased angiogenesis after MI.
A The heart weight to body weight ratio (n = 8). B Representative cross-sectional images and quantitative data of hearts stained with Masson’s trichrome at day 28 post-MI (n = 5). C Representation and quantification of IHC staining for TUNEL + cardiomyocytes in the border zone of infarcted hearts at day 3 post-MI (n = 5). *P < 0.05, **P < 0.01, ***P < 0.001 versus AAV-NC group. #P < 0.05, ##P < 0.01, ###P < 0.001 versus AAV-NC-MI group. D The viability of NRCMs was measured by the Cell Counting Kit-8 (CCK8) in the medium (n = 3). E Fold changes of LDH activities in the NRCMs medium. *P < 0.05 versus Ad-NC group (n = 3). #P < 0.05, ##P < 0.01 versus Ad-NC-OGD group. Data were expressed as mean ± SEM. Unpaired Student’s t-test (B), two-way ANOVA (A and C–E).

