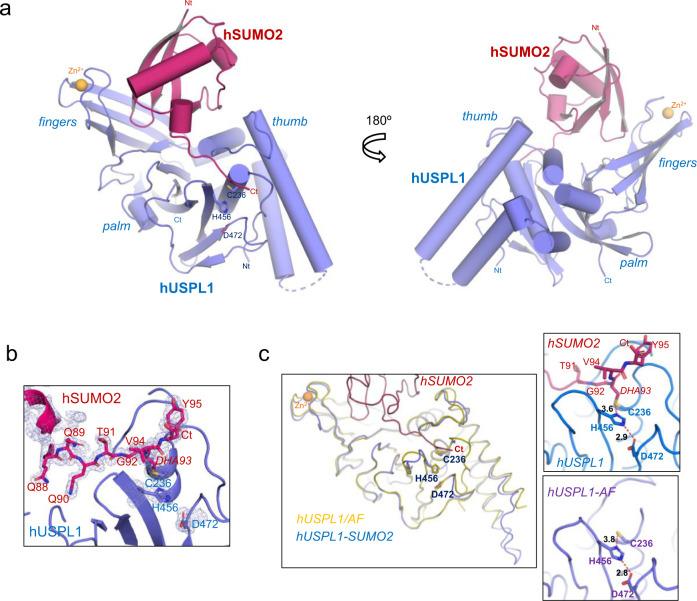
Fig. 2. Crystal structure of the complex of human USPL1 with SUMO2 precursor.
a Two views of the USPL1-SUMO2 complex structure are shown in cartoon representation. USPL1 catalytic domain and SUMO2 precursor are shown in purple and red, respectively. USP right hand-like domains are labeled. The catalytic residues are labeled and depicted in stick representation. Zinc atom is shown in yellow. b Detailed view of the 2Fo-Fc electron density map contoured at 1σ of the C-terminal tail of SUMO2 bound to USPL1. Same color code as in (a). c Structural superimposition between USPL1-SUMO2 (blue) complex and the USPL1 AlphaFold (AF) model (yellow). Close-up views of the superimposition of active sites of USPL1 and AF model are shown in the right panel. Catalytic triad residues from USPL1 are labeled and shown in stick representation, whereas the corresponding residues from AF model are shown below. Hydrogen bonds are represented by dashed lines and the distances (Å) are also depicted.

