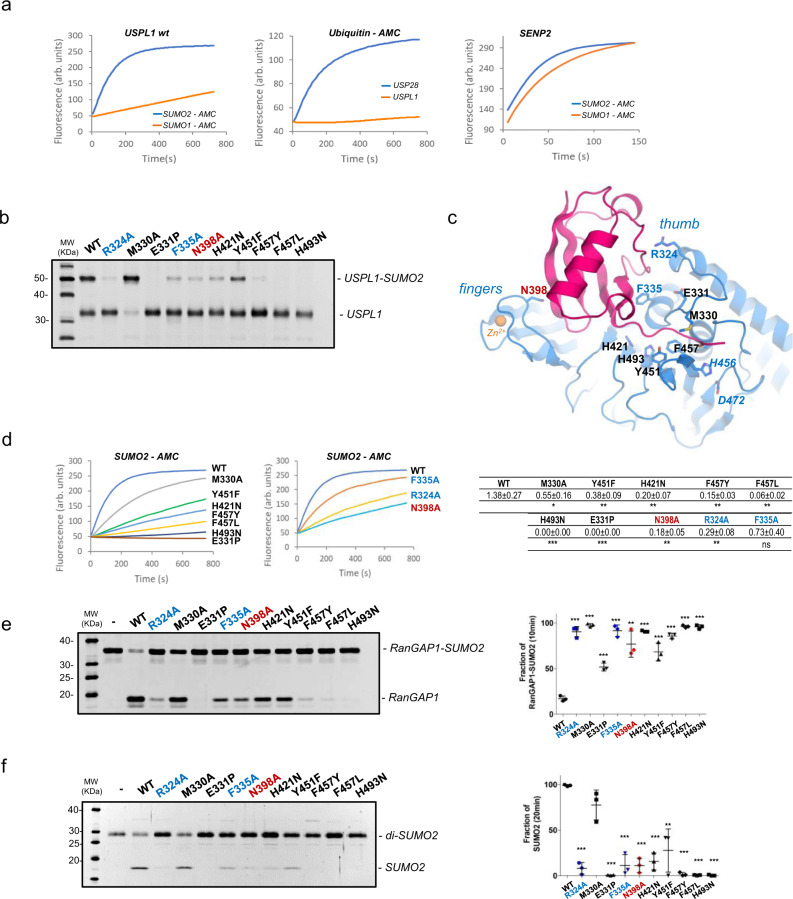
Fig. 6. Functional analysis of the SUMO2-USPL1 interface.
a Left, activity assay of USPL1 with SUMO1-AMC and SUMO2-AMC. Middle, activity assay of Ubiquitin-AMC with USPL1 and USP28. Right, activity assay of SENP2 with SUMO1-AMC and SUMO2-AMC. Reactions were conducted in triplicate and the average curve is displayed. b Binding interaction of USPL1 point mutants with SUMO2-DHA. Reaction assays were conducted with USPL1 wild-type and mutants for 3 h. n = 3 technical replicates. c USPL1-SUMO2 complex structure shown in cartoon representation. USPL1 catalytic domain and SUMO2 precursor are shown in purple and red, respectively. USP right hand-like domains are labeled. Interface residues are labeled and shown in stick representation. Zinc atom is shown in yellow. d Left, activity assays of USPL1 wild type and mutants of the C-terminal tail interface using SUMO2-AMC. Middle, similar activity assays of USPL1 wild type and mutants of the thumb and fingers subdomains. Right, table indicating the mean slope values plus/minus the standard deviation of the activity assays. n = 3 technical replicates. Significance was measured by a two-tailed unpaired t-test relative to wild-type. *P < 0.05, **P < 0.01, ***P < 0.001. e Left, endpoint assays of USPL1 wild type and mutants using the RanGAP1-SUMO2 substrate. Right, plot of the RanGAP1-SUMO2 fraction after 10 min reaction. Data values represent the mean ± SD, n = 3 technical replicates. Significance was measured by a two-tailed unpaired t-test relative to wild-type. *P < 0.05, **P < 0.01, ***P < 0.001. Exact P values from left to right: <0.0001, 0.0868, <0.0001, 0.0002, <0.0001, 0.0001, 0.0065, <0.0001, <0.0001, <0.0001. f Left, endpoint assays of USPL1 wild type and mutants using di-SUMO2 substrate. Right, plot representation of the product SUMO2 fraction after 20 min reaction. Data values represent the mean ± SD, n = 3 technical replicates. Significance was measured by a two-tailed unpaired t-test relative to wild-type. *P < 0.05, **P < 0.01, ***P < 0.001. Exact P values from left to right: <0.0001, <0.0001, 0.0003, <0.0001, 0.0021, <0.0001, 0.0009, <0.0001, <0.0001, <0.0001. Source data for Fig. 6a, b, d, e, and f are provided as a Source Data file.

