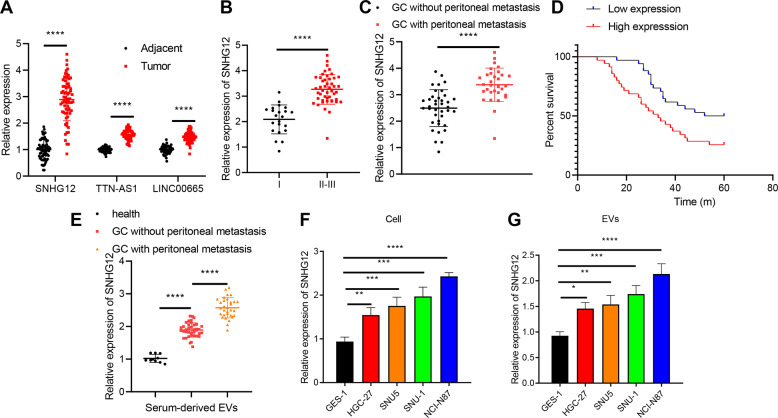
Fig. 2. The expression pattern of SNHG12 in GC tissues and cells and its relationship with peritoneal metastasis and prognosis in patients with GC.
A The expression of SNHG12, LINC00665, and TTN-AS1 in GC and adjacent normal tissues examined using RT-qPCR (n = 69). B The relative level of SNHG12 in GC tissues from patients with GC of different clinical stages (I (n = 22); II and III (n = 47)) determined using RT-qPCR. C SNHG12 expression pattern in GC tissues with peritoneal metastasis (n = 31) and GC tissues without peritoneal metastasis (n = 38) from patients with GC detected by RT-qPCR. D The correlation between SNHG12 expression pattern and the overall survival of patients with GC analyzed by Kaplan–Meier survival curve. E The expression pattern of SNHG12 in serum-derived EVs in 10 healthy volunteers, 38 patients with non-metastatic GC, and 31 patients with metastatic GC determined by RT-qPCR. F SNHG12 expression pattern in normal human gastric mucosal cells GES-1 and GC cell lines HGC-27, NCI-N87, SNU-1, and SNU5 measured using RT-qPCR. G SNHG12 expression pattern in EVs isolated from each group of GC cells evaluated by RT-qPCR. *p < 0.05, **p < 0.01, ***p < 0.001, ****p < 0.0001. The experiment was conducted three times independently.

