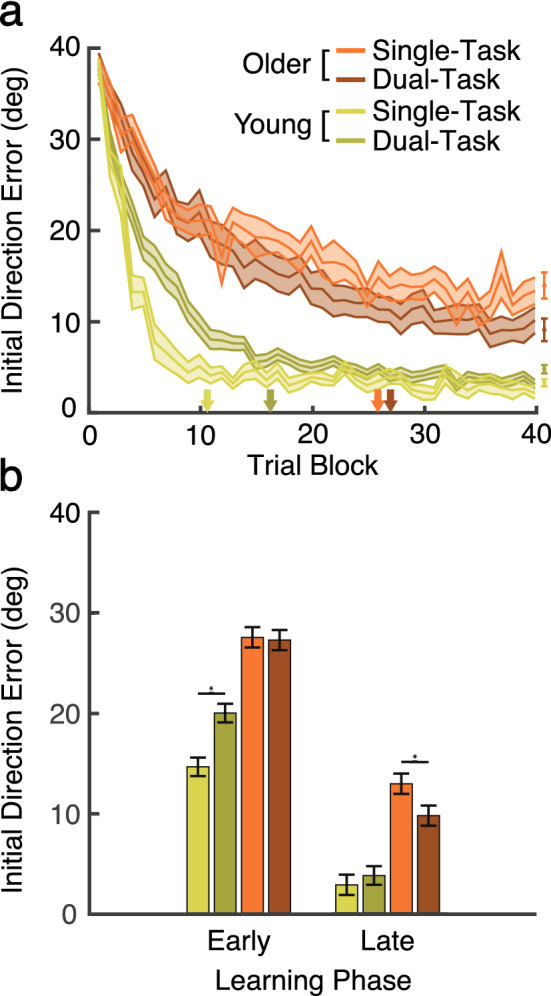
Figure 2.

Visuomotor adaptation performance in the learning phase. We compare initial direction errors from young (green) and older (orange) adults across the single task (lighter color) and dual-task groups (darker color). (a) Initial direction error. The single dot data points on the far right (after the 40th trial block) indicate the estimated asymptotic reach value for each group. The arrows on the abscissa indicate the trial block at which each group reached asymptotic performance. The ribbons represent between-subjects standard error (SE). (b) Mean initial direction error in the early and late learning phases. Error bars indicate standard error (SE).
