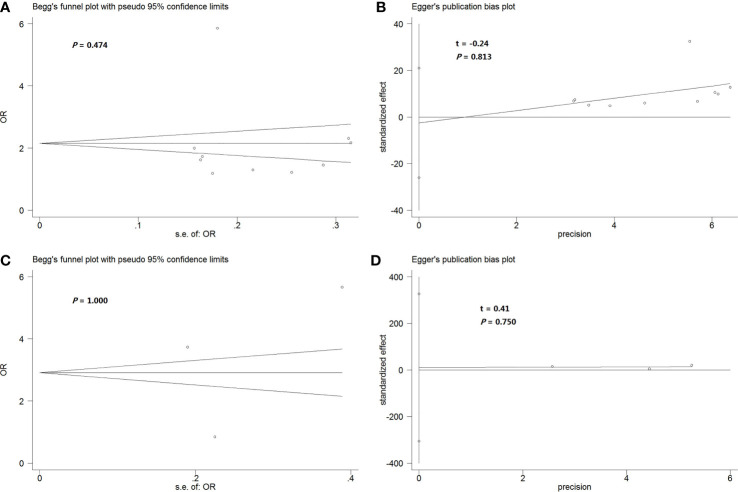
Figure 3.
(A, B) Begg’s funnel plot (A) and Egger’s test (B) to assess publication bias in the meta-analysis of the association between rs266729 polymorphism and NAFLD risk in the total population according to the dominant genetic model. (C, D) Begg’s funnel plot (C) and Egger’s test (D) to assess publication bias in the meta-analysis of the association between rs3774261polymorphism and NAFLD risk in the total population according to the dominant genetic model. NAFLD, nonalcoholic fatty liver disease; OR, odds ratio.

