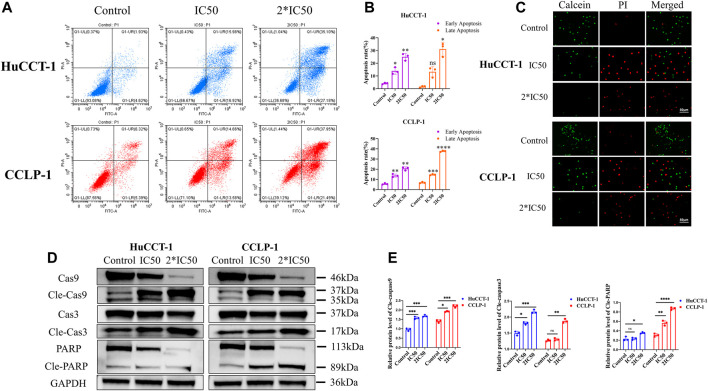
FIGURE 2.
Silibinin induced apoptosis in HuCCT-1 and CCLP-1 cells. (A,B). Detection of apoptosis by FCM and quantitative analysis of the apoptosis rate. HuCCT-1 and CCLP-1 cells were treated with IC50 and 2*IC50 concentrations of silibinin for 48 h (C). The live/dead staining assay results of the HuCCT-1 and CCLP-1 cell lines treated with silibinin for 48 h. Red dots represent dead cells and green dots represent surviving cells. (D). Western blotting results of HuCCT-1 and CCLP-1 cell lines treated with IC50 and 2*IC50 concentrations of silibinin for 48 h. The apoptosis-related proteins were identified. (E). The quantification results of cle-caspase-9, cle-caspase-3 and cle-PARP. Data are shown as mean ± SD. *p < 0.05, **p < 0.01, ***p < 0.001, ****p < 0.0001, significantly difference compared to the control group.

